Fig. 1:

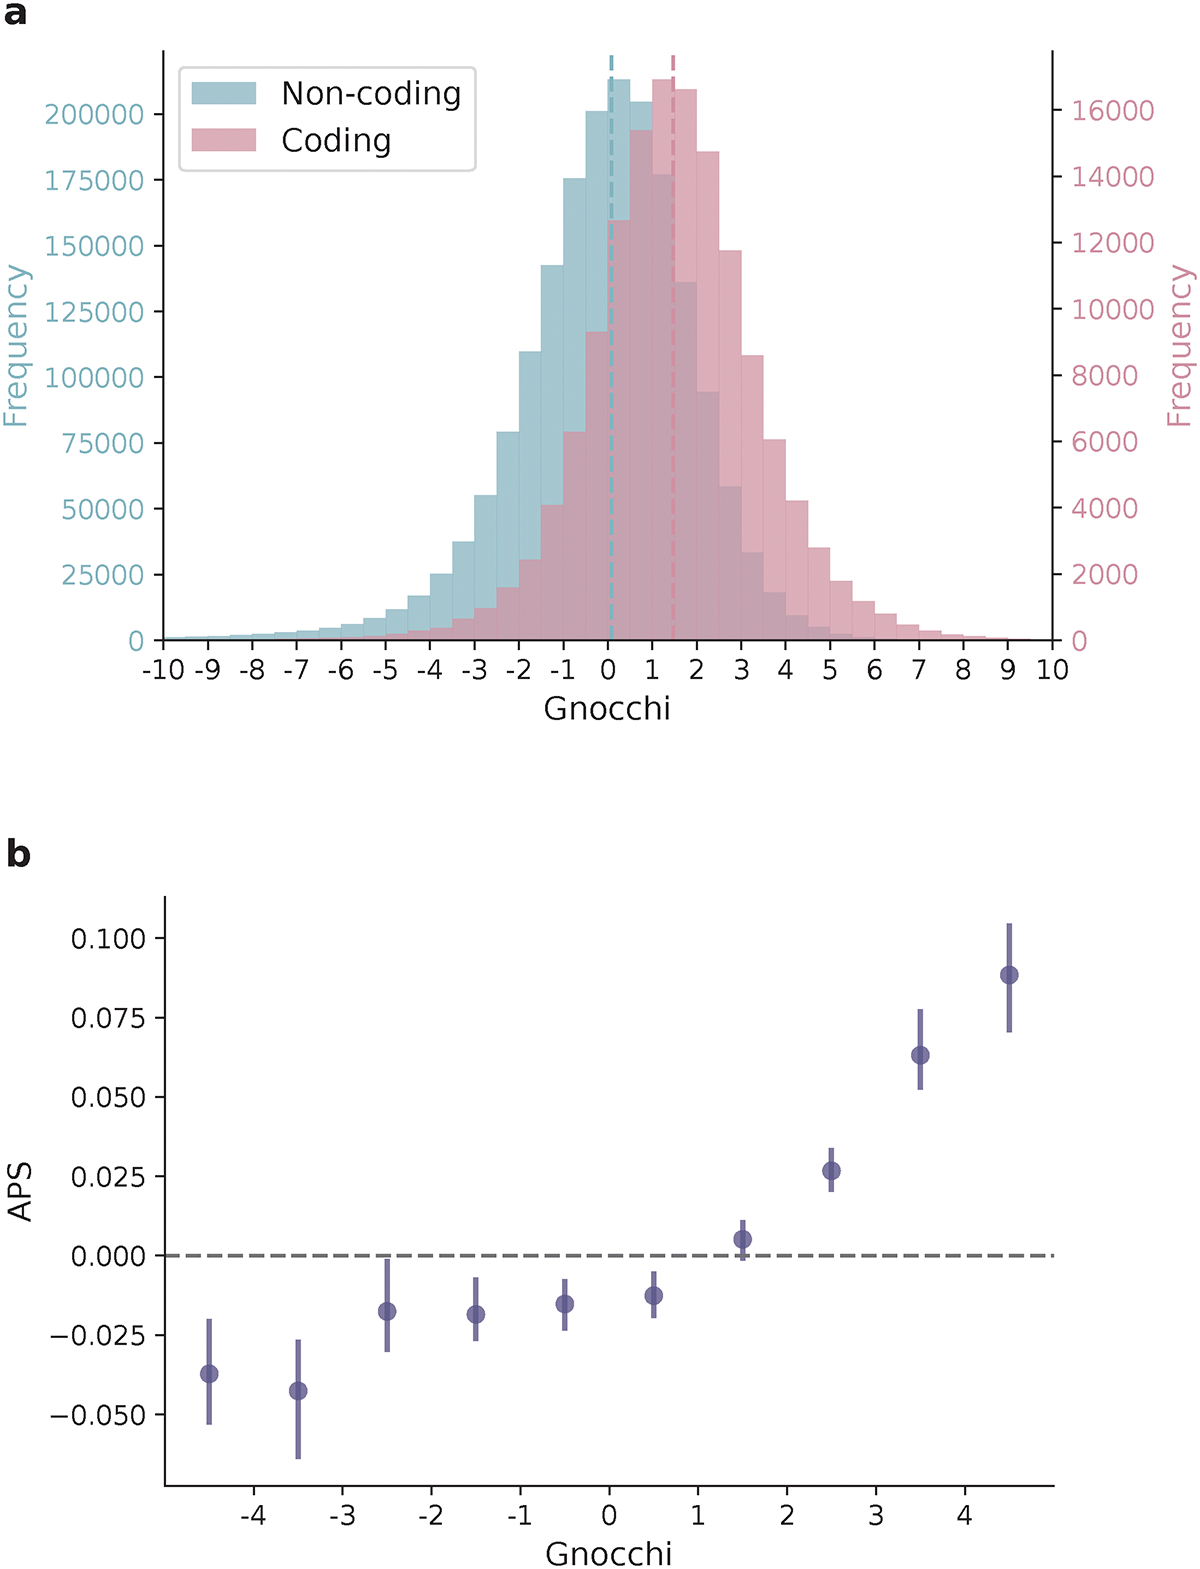
Distribution of Gnocchi scores across the genome. a, Histograms of Gnocchi scores for 1,984,900 1kb windows across the human autosomes. Windows overlapping coding regions (N=141,341 with ≥ 1bp coding sequence; red) overall exhibit a higher Gnocchi score (stronger negative selection) than windows that are exclusively non-coding (N=1,843,559; blue); dashed lines indicate the medians. b, The correlation between Gnocchi score and the adjusted proportion of singletons (APS) score developed for structural variation (SV) constraint. A collection of 116,184 autosomal SVs were assessed using Gnocchi by assigning each SV the highest Gnocchi score among all overlapping 1kb windows, which shows a significant positive correlation with the SV constraint metric APS. Error bars indicate 100-fold bootstrapped 95% confidence intervals of the mean values.
