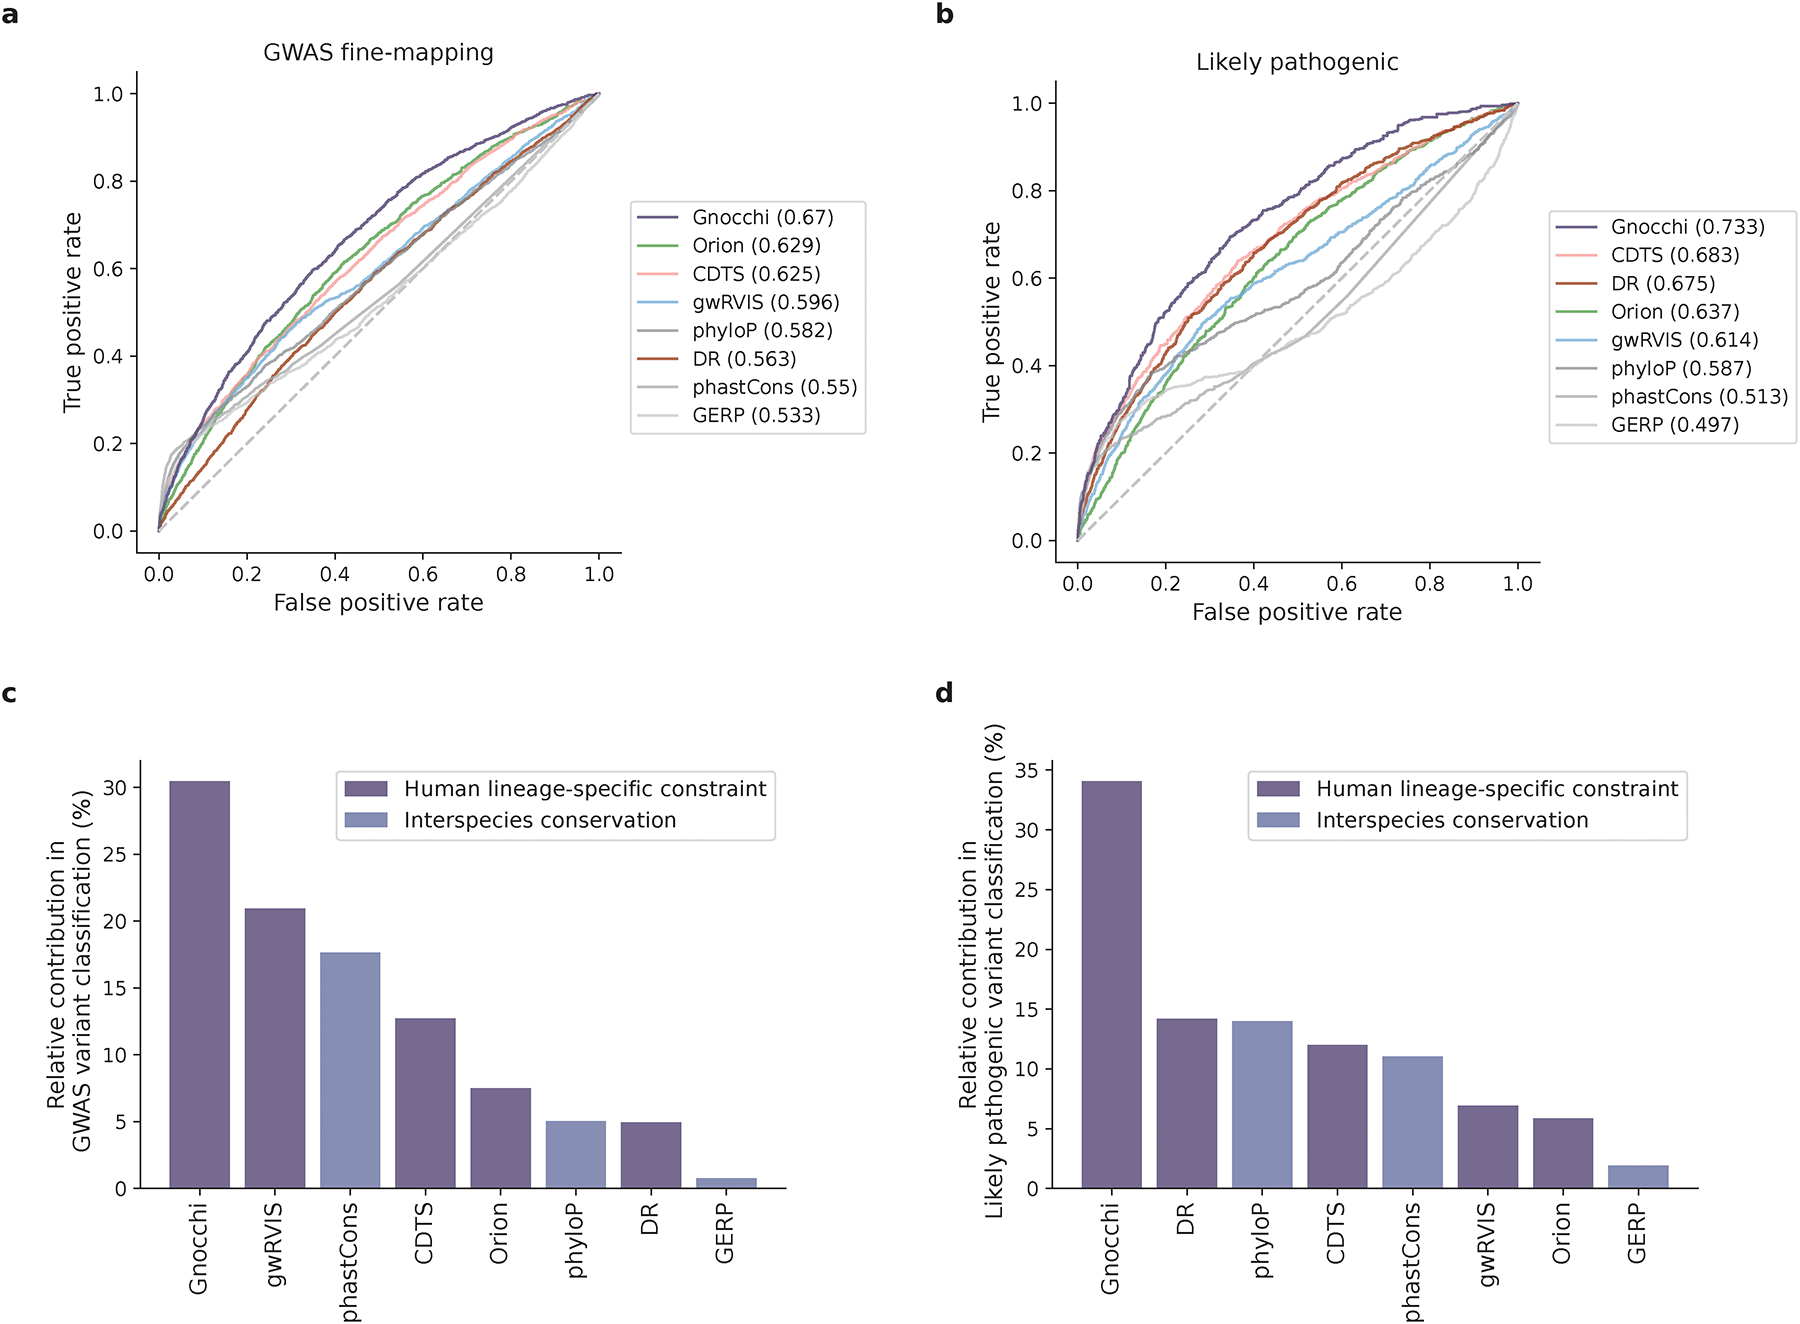
Fig. 3:

Performance of Gnocchi and other predictive metrics in prioritizing non-coding variants. a,b, Receiver operating characteristic (ROC) curves of Gnocchi and other seven metrics in classifying putative functional non-coding variants – 2,191 GWAS fine-mapping variants (a) and 1,026 likely pathogenic variants (b) – against background variants in the population. The performance of each metric was measured and ranked by the area under curve (AUC) statistic. c,d, The relative contribution of different metrics in classifying GWAS variants (b) and likely pathogenic variants (c). The eight metrics were modeled as eight independent predictors for the classification, and the relative contribution of one predictor over another was evaluated by estimating their additional contributions across all subset models.
