Extended Data Fig. 1:

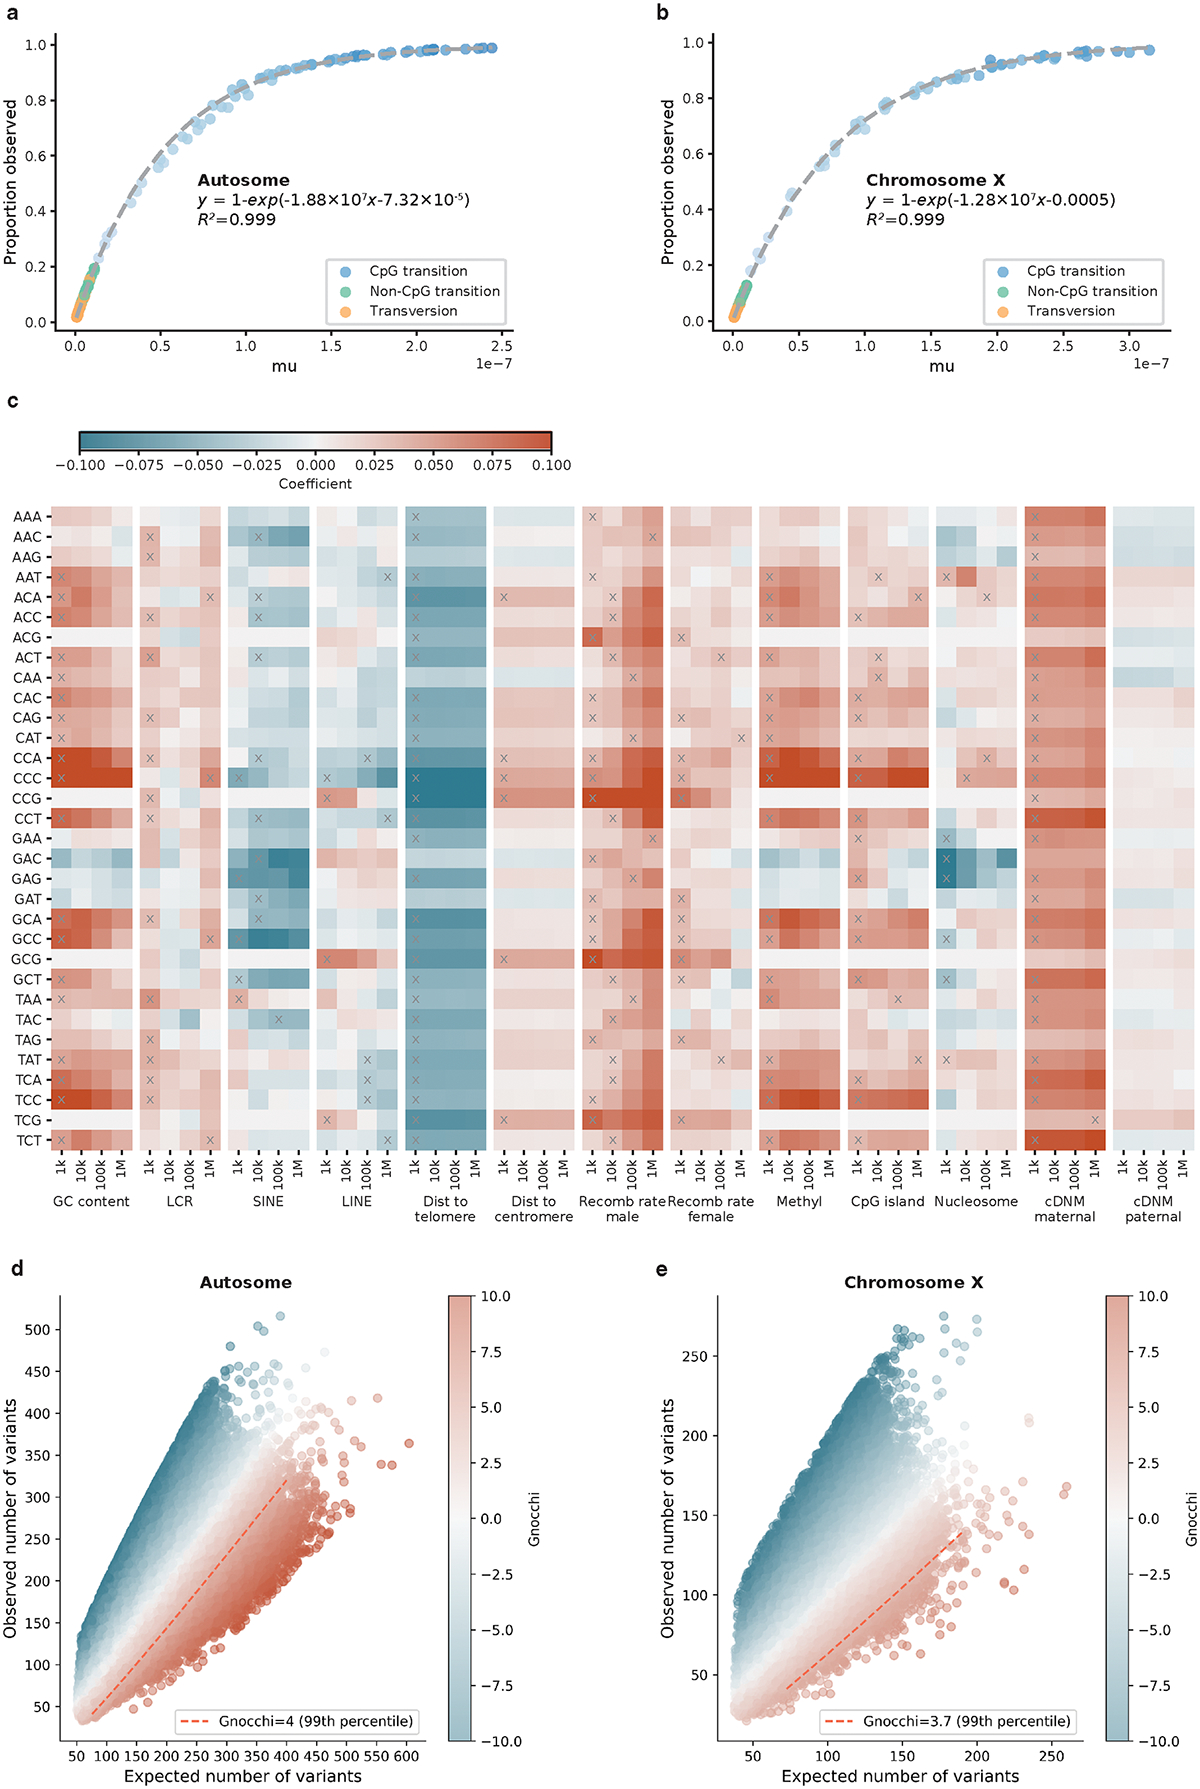
Construction of mutational model and Gnocchi score. a,b, Estimation of trinucleotide context-specific mutation rates. The proportion of possible variants observed for each substitution and context in 76,156 gnomAD genomes (y-axis) is exponentially correlated with the absolute mutation rate estimated from 1,000 downsampled genomes (x-axis). Fit lines were modeled separately for human autosomes (a) and chromosome X (b). c, Estimation of the effects of regional genomic features on mutation rates. The effects of 13 genomic features at four scales (window sizes 1kb-1Mb; x-axis) on the mutation rate of 32 trinucleotide contexts (y-axis) are shown, colored by the coefficient from regressing de novo mutations (DNMs) on each specific feature and window size. Red/Blue color indicates a positive/negative effect of increasing the feature value on mutation rates; grey crosses indicate significant features at the smallest possible window size after Bonferroni correction for 13×4=52 tests. Abbreviations: LCR=low-complexity region, SINE/LINE=short/long interspersed nuclear element, Dist=Distance, Recomb=Recombination, Methyl=Methylation. d,e, The distribution of Gnocchi score as a function of expected and observed variation. Each point represents the Gnocchi score of a 1kb window on the genome (N=1,984,900 on autosomes (d) and N=57,729 on chromosome X (e)), which quantifies the deviation of observed variation from expectation. A positive Gnocchi score (red) indicates depletion of variation (observed<expected) and the higher the score the stronger the depletion; the red dashed line indicates the 99th percentile of Gnocchi scores across the autosomes (d) or chromosome X (e).
