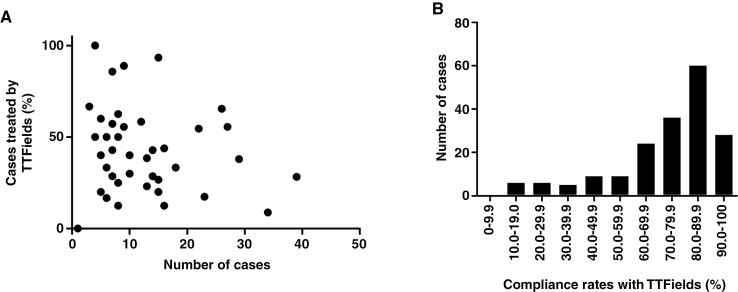
Figure 2.
Tumor-treating field (TTField) usage rates according to institution and compliance rates with TTFields. (A) Scattered graph demonstrating the relationship between the total number of patients that met the inclusion criteria during the study period and patients who received TTField treatment at the 45 institutions. (B) Bar graph demonstrating the distribution of the average daily compliance rate with TTFields.

