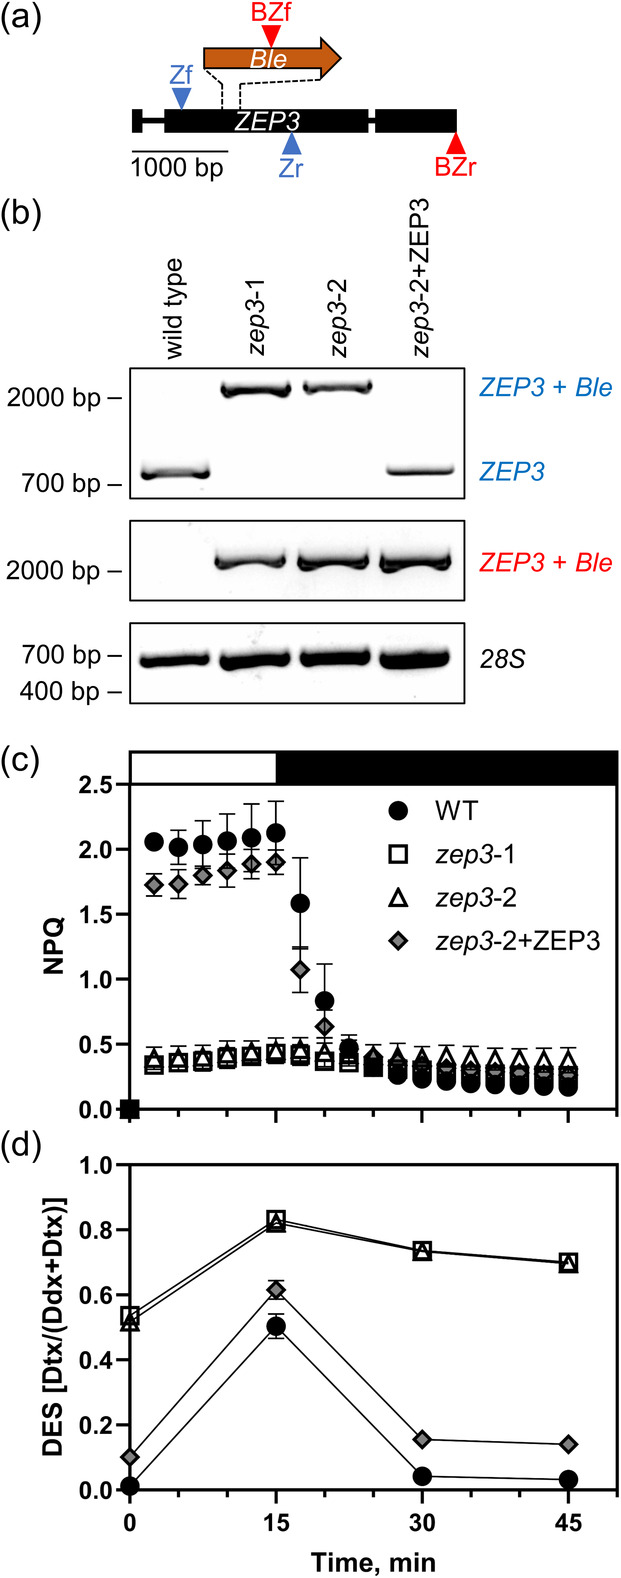
Figure 1.

ZEP3 gene knockout design, verification of mutations, quantification of NPQ capacity and xanthophyll cycling in WT, mutant and complemented strains.
(a) Schematic of PtZEP3 gene and insertion of bleomycin resistance gene (Ble) for knockout.
(b) Binding sites for guide RNAs are within the dashed lines, allowing for CRISPR‐mediated cutting and subsequent recombination of the Ble gene at the site. Primer binding sites are indicated by arrowheads, with forward primers above the genes and reverse primers below the genes. There is a primer pair for ZEP3 amplification (Zf, Zr) and a primer pair for ZEP3+Ble amplification (BZf, BZr). Gel electrophoresis results for WT, two zep3 mutants, and one ZEP3 complemented strain.
(c, d) Labels on the right show expected band positions for different strains, with the colored labels corresponding to the primer colors in (A) and a 28S amplification with a black label as a control. WT and complemented strains show a normal ZEP3 band for the Zf/Zr amplification while mutants have a ZEP3+Ble band. Mutant and complemented strains show a ZEP3+Ble band for the BZf/BZr amplification while WT has no band. Relevant base pair migration positions from a Thermo Scientific 1 kb Plus DNA ladder are given on the left. B Cells were exposed to 15 min of high light (2000 μmol photons m−2 sec−1, white bar) and 30 min of low light (75 μmol photons m−2 sec−1, black bar). NPQ dynamics were measured with a DUAL‐PAM fluorometer (c) and DES was estimated via HPLC analyses (d). Dynamics were observed for Phaeodactylum WT, two zep3 mutant strains, and one ZEP3 complemented strain (zep3‐2 mutant complemented with native ZEP3 gene, zep3‐2+ZEP3). Cells were grown in sinusoidal light and were collected an hour post‐dawn. Points are averages with error bars representing one standard deviation of biological replicates (n = 3).
