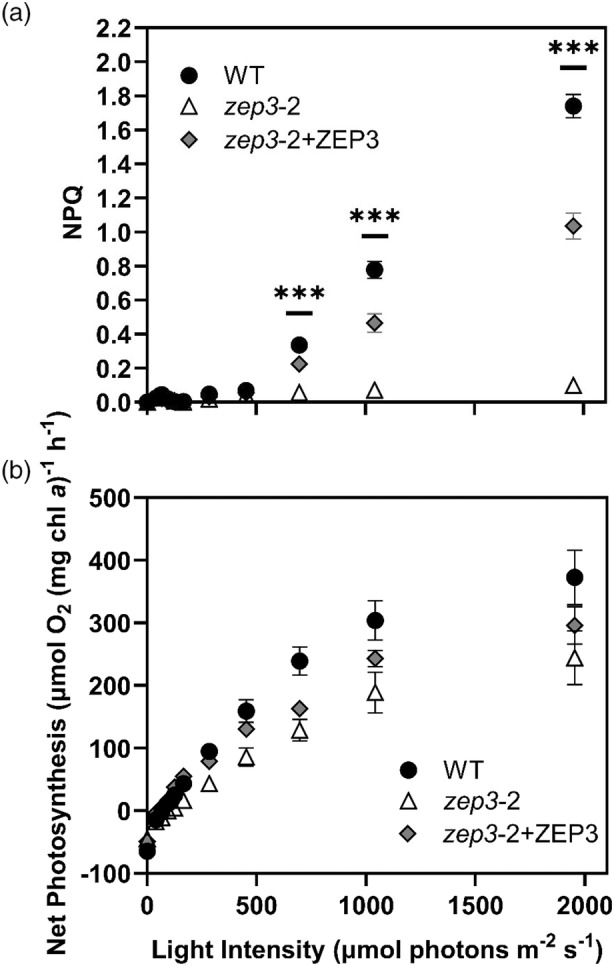
Figure 4.

Non‐photochemical quenching (NPQ) capacity and net photosynthesis of Phaeodactylum cultures during an P‐I curve.
(a) NPQ measured with a DUAL‐PAM fluorometer.
(b) Net photosynthesis derived from gross oxygen evolution rates were measured with a FireSting oxygen probe, corrected for dark respiration rate, and normalized to total chlorophyll a. Cells were collected from sinusoidal light grown cultures and samples were taken within 2 h of solar noon. Dynamics were observed for Phaeodactylum WT, one zep3 mutant strain, and one ZEP3 complemented strain. Points are averages with error bars representing one standard deviation (n = 3). Asterisks represent timepoints wherein all groups have statistically significant differences from one another, tested via an ordinary two‐way analysis of variance (anova) with a Tukey's multiple comparisons test (***P < 0.0005).
