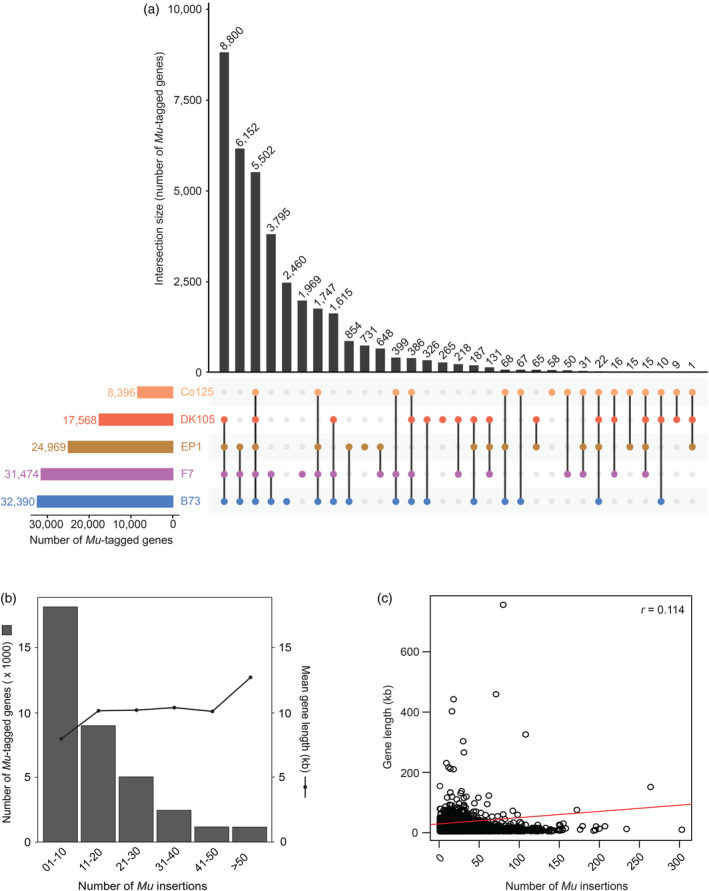
Figure 1.

Overlap of genes affected by Mu insertions and distribution of insertions.
(a) Intersections of genes, tagged in BonnMu F2‐families of the two dent lines B73 and Co125 and three flint lines DK105, EP1, and F7, which have been mutagenized in this study. The UpSet plot displays 31 intersections. The lines connect overlapping genes among different genetic backgrounds. The total number of intersected genes is displayed above each bar.
(b) Number of tagged genes and associated mean gene length plotted against the number of Mu insertions.
(c) Distribution of the length of affected genes plotted against the number of individual Mu insertions. The calculated Pearson correlation coefficient is r = 0.114 (P < 0.001).
