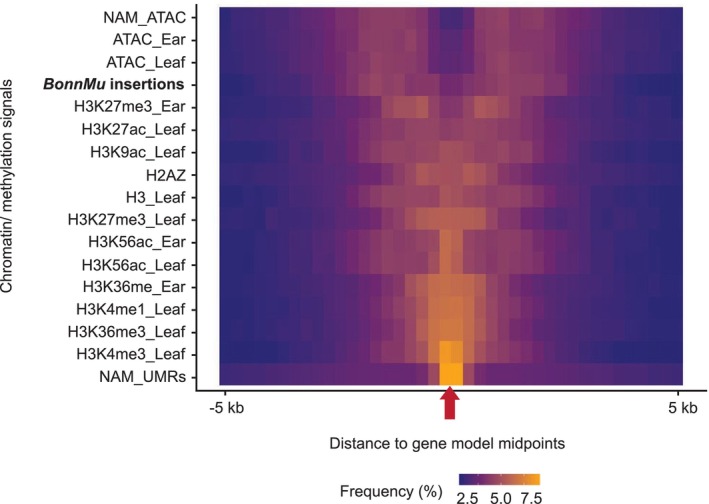
Figure 4.

BonnMu insertions in the context of the epigenomic landscape surrounding maize genes.
Frequency distribution of BonnMu insertions, chromatin modifications, and chromatin accessibility in relation to the entire set of genes in the maize genome. The red arrow on the horizontal center of the plot indicates the midpoint of all maize gene models ignoring strand. Bins of 250 bp in size are presented on both sides of this midpoint, representing a region 5 kb upstream and 5 kb downstream of the gene midpoint. The frequency of Mu insertions, chromatin marks or accessibility signals is color‐coded (yellow = higher frequency; blue = lower frequency). NAM, nested association mapping; UMR, unmethylated regions.
