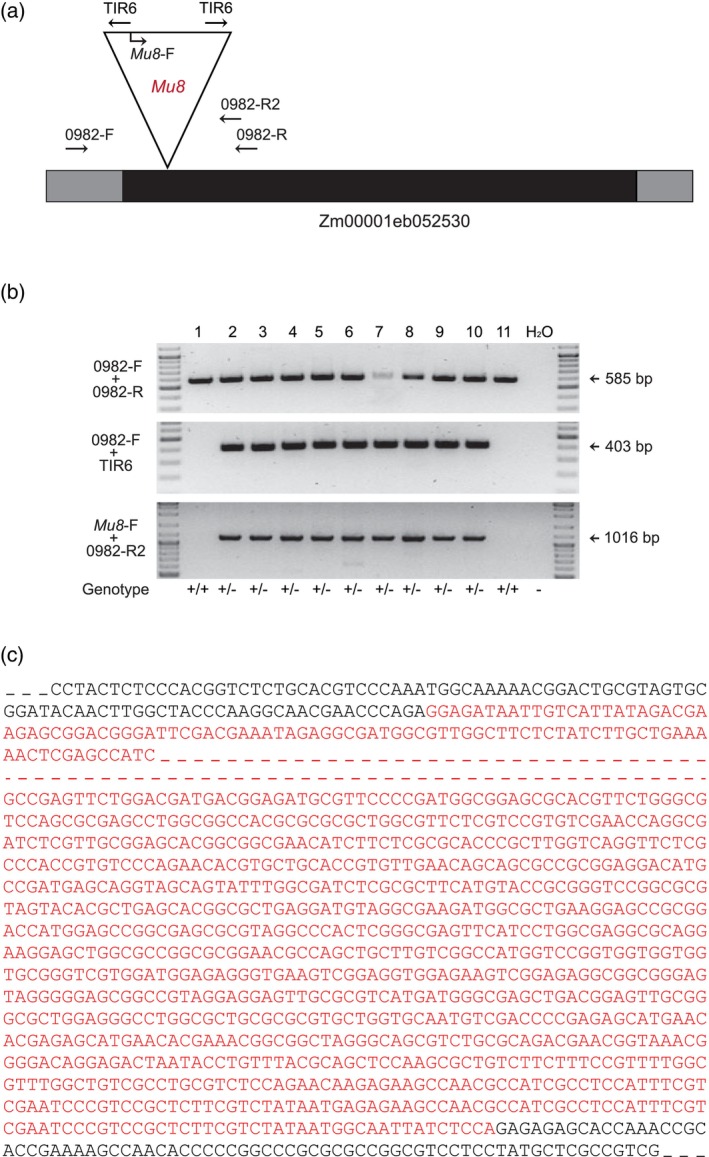
Figure 5.

PCR‐based segregation analysis.
(a) Structure of the gene Zm00001eb052530. The single exon is illustrated as a black box and UTRs as gray boxes. The Mu8 insertion in the exon is shown as a triangle. Gene‐ and TIR‐specific primer sites are indicated as arrows.
(b) PCR segregation analysis of 11 individual plants of the segregating F2‐family BonnMu‐2‐A‐0982. Gene‐specific primers (0982‐F + 0982‐R) flanking the insertion site were combined to detect the presence of a wild‐type copy of the gene. Additionally, one gene‐specific primer along with a TIR‐specific primer (0982‐F + TIR6) were used to test for the presence of an insertion in the gene. To confirm the Mu8 insertion, a combination of a Mu8‐specific primer and a gene‐specific primer (Mu8‐F + 0982‐R2) was used. Deionized water (H2O) was used as a negative control.
(c) Confirmation of the Mu8 insertion the gene Zm00001eb052530 by Sanger sequencing. The sequence was amplified by combining two primer pairs: 0982‐F + TIR6 and Mu8‐F + 0982‐R2. The sequence represents a part of the gene with the Mu8 insertion depicted in red letters and dashed lines. The black letters represent part of the gene sequence, while dashed lines in black represent the remaining gene sequence that was not analyzed in detail.
