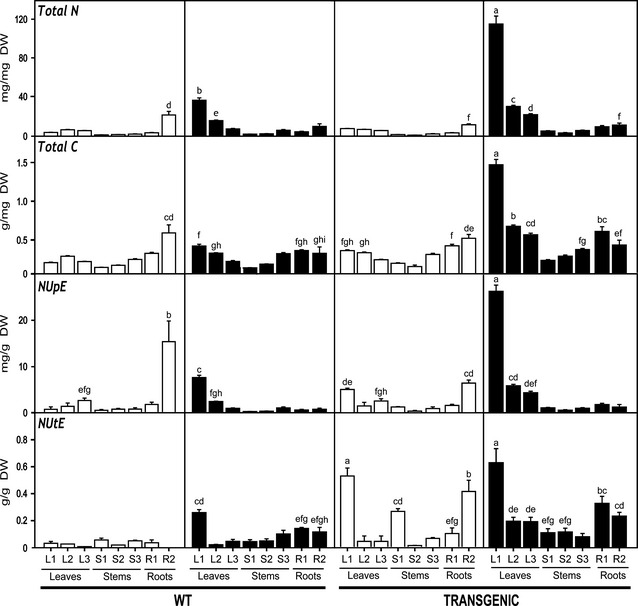
Figure 2.

Spatial distribution of total N, total C, NutE and NupE in WT and transgenic poplars growing at different nitrate levels. Open bars correspond to poplars irrigated with a solution containing 10 mm of nitrate. Closed bars correspond to poplars irrigated with a solution containing 50 mm of nitrate. Values are means ± SD of three independent plant samples. Different letters indicate significant differences between samples at P < 0.001. The same notation is applicable to legends of Figures 3, 7 and 8.
