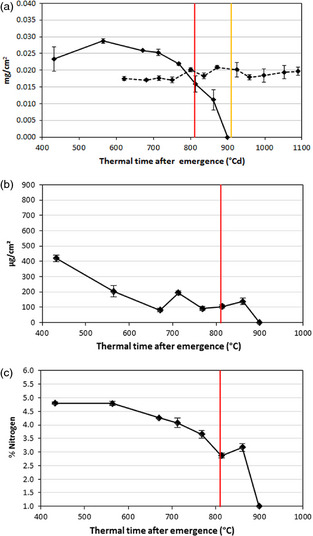
Figure 1.

Physiological measurements during leaf senescence. (a) Chlorophyll content in mg/cm2 under field (solid line) and glasshouse conditions (dotted line); (b) total soluble carbohydrates in μg/cm² under field conditions and (c) total nitrogen percentage under field conditions. The red line indicates anthesis time under field conditions and the orange line indicates anthesis time under glasshouse conditions. Error bars correspond to standard errors.
