Figure 2.

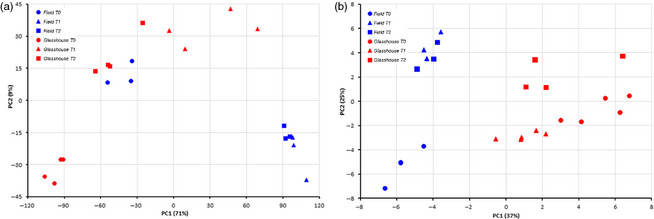
Principal component analyses. (a) Transcript analysis. (b) Metabolite analysis. The blue and red dots correspond to the biological replicates of field and glasshouse experiments, respectively, during leaf development.

Principal component analyses. (a) Transcript analysis. (b) Metabolite analysis. The blue and red dots correspond to the biological replicates of field and glasshouse experiments, respectively, during leaf development.