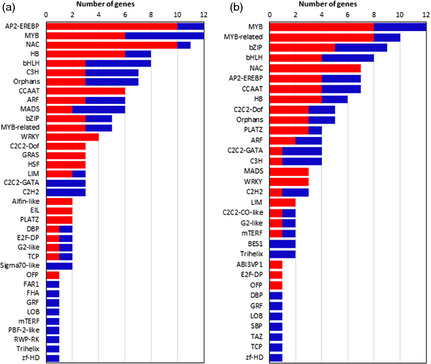
Figure 5.

Differentially expressed putative transcription factors derived from the microarray analysis. Differentially expressed genes during leaf development (T0 vs. T1 and/or T2 vs. T0) in the (a) field and (b) glasshouse experiments. The red and blue bars indicate the number of up‐regulated and down‐regulated genes, respectively.
