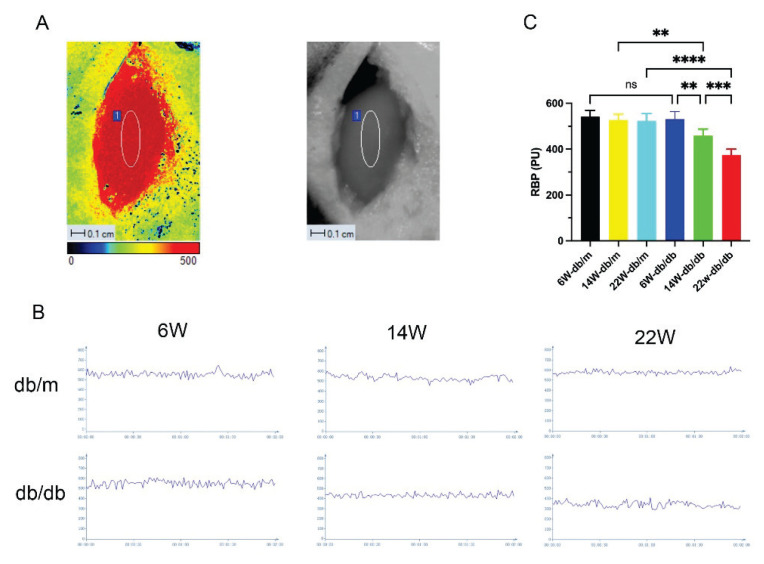
Fig. 3.
Live images of mice renal blood perfusion (RBP) detected by laser speckle contrast imaging (LSCI) (A); real-time RBP images (B) and RBP bar graphs (C) for each group of mice. Data are expressed as mean ± standard deviation (SD), n=6. For C: ** P<0.01; *** P<0.001; **** P<0.0001; ns, not significant.

