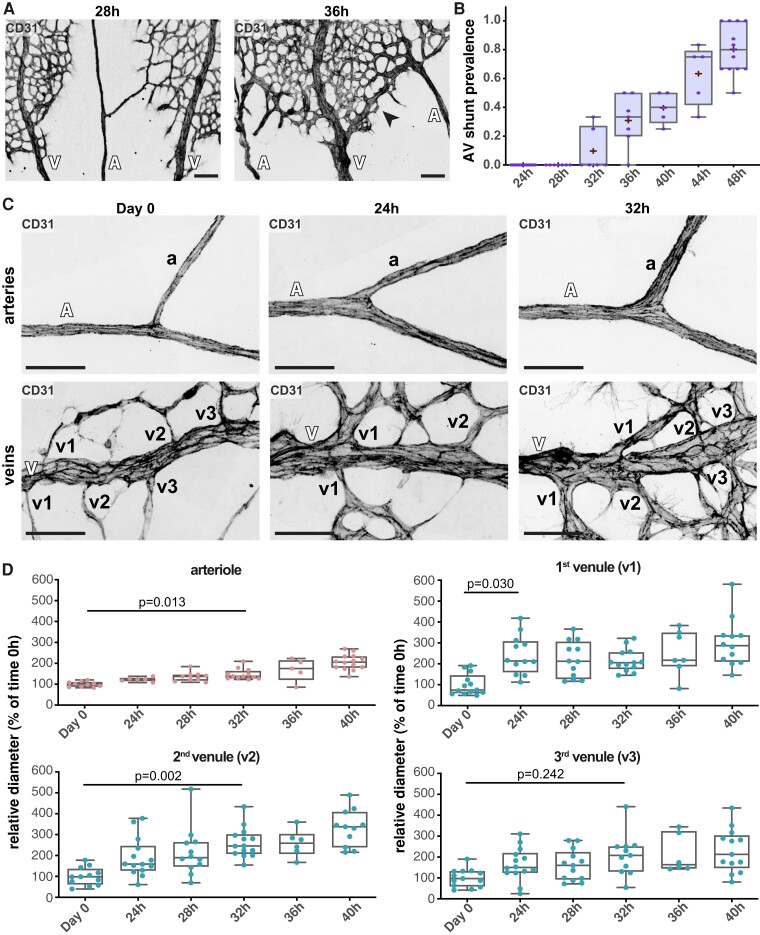
Figure 2.
Fine time-course analysis of AV shunt formation. (A) Representative images of mouse retinas at 28 and 36 h stained for CD31 (grey). Black arrow: AV shunt; A, artery; V, vein. Scale bar: 200 µm. (B) Quantification of total AV shunt prevalence every 4 h between 24 and 48 h. 24 h, 44 AV sections (8 pups); 28 h, 31 AV sections (7 pups); 32 h, 29 AV sections (5 pups); 36 h, 34 AV sections (5 pups); 40 h, 23 AV sections (3 pups); 44 h, 23 AV sections (3 pups); 48 h, 56 AV sections (8 pups). Each dot represents a mouse retina. P-values from Fisher’s exact t-test and Fisher’s post hoc test using Benjamini–Hochberg correction for multiple comparisons. (C) Representative images of OIR arterial (top) and venous (bottom) mouse retina vessels (A, artery; a, arteriole; V, vein; v, venule) at 0, 24, and 32 h stained for CD31 (grey). Scale bar: 50 µm. (D) Quantification of arteriole and first (v1), second (v2,) and third (v3) venule normalized diameter (% of mean diameter at Day 0) between 0 and 40 h. Each dot represents a second-order vessel from Day 0 (3 pups); 24 h (3 pups); 28 h (3 pups); 32 h (3 pups); 36 h (3 pups); and 40 h (3 pups). Each dot represents a mouse retina. P-values from Kruskal–Wallis test and Dunn’s post hoc test using Benjamini–Hochberg correction for multiple comparisons.

