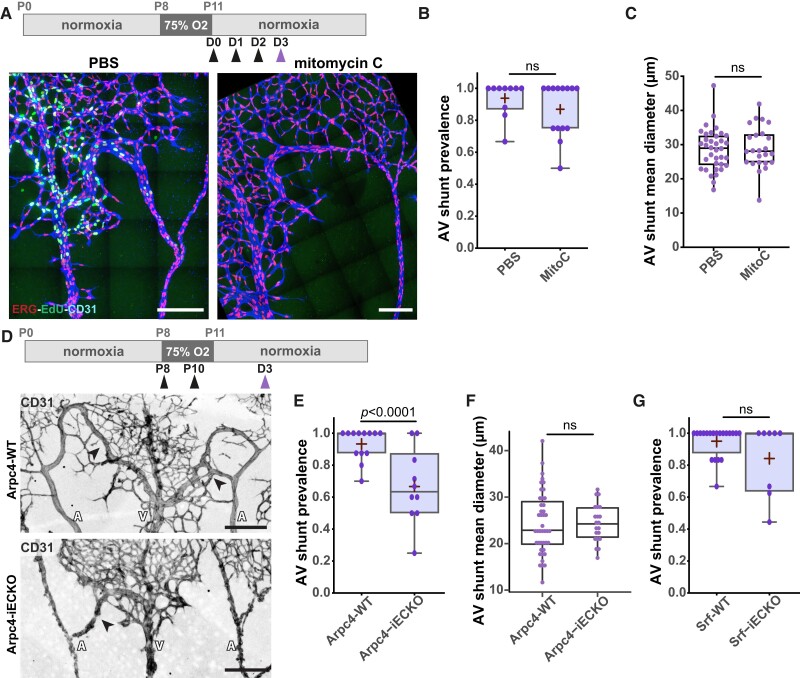
Figure 3.
EC proliferation and migration have minor contributions to AV shunt formation. (A) Top panel: schematic of mitomycin C treatment. Black arrow: time of vehicle or mitomycin C injection. Purple arrow: time of collection. Bottom panel: representative images of retinas at Day 3 treated with PBS or mitomycin C stained for ECs (CD31, blue), EC nuclei (ERG, red), and proliferative cells (EdU, green). White arrows: AV shunts; A, artery; V, vein. Scale bar: 200 µm. (B) Quantification of AV shunt prevalence at Day 3 in PBS- (33 AV sections, 5 pups) and mitomycin C (46 AV sections, 7 pups)-treated retinas. Each dot represents a mouse retina. P-value from Mann–Whitney U test. (C) Quantification of AV shunt mean diameter at Day 3 in PBS- (21 AV sections, 3 pups) and mitomycin C (14 AV sections, 3 pups)-treated retinas. Each dot represents a mouse retina. P-value from Mann–Whitney U test. (D) Top panel: schematic of the experimental protocol using Arpc4/Srf mouse strains. Black arrow: tamoxifen injection. Purple arrow: time of collection. Representative images of Arpc4-WT and Arpc4-iECKO retinas on Day 3 stained for ECs (CD31, grey). Black arrows: AV shunts; A, artery; V, vein. Scale bar: 200 µm. (E) Quantification of AV shunt prevalence at Day 3 in Arpc4-WT (91 AV sections, 7 pups) and Arpc4-iECKO (57 AV sections, 5 pups) retinas. Each dot represents a mouse retina. P-value from Mann–Whitney U test. (F) Quantification of AV shunt mean diameter at Day 3 in Arpc4-WT (7 pups) and Arpc4-iECKO (5 pups) retinas. Each dot represents an AV shunt. Each dot represents a mouse retina. P-value from Mann–Whitney U test. (G) Quantification of AV shunt prevalence at Day 3 in Srf-WT (85 AV sections, 12 pups) and Srf-iECKO (45 AV sections, 5 pups) retinas. Each dot represents a mouse retina. P-value from Mann–Whitney U test.

