Figure 4.
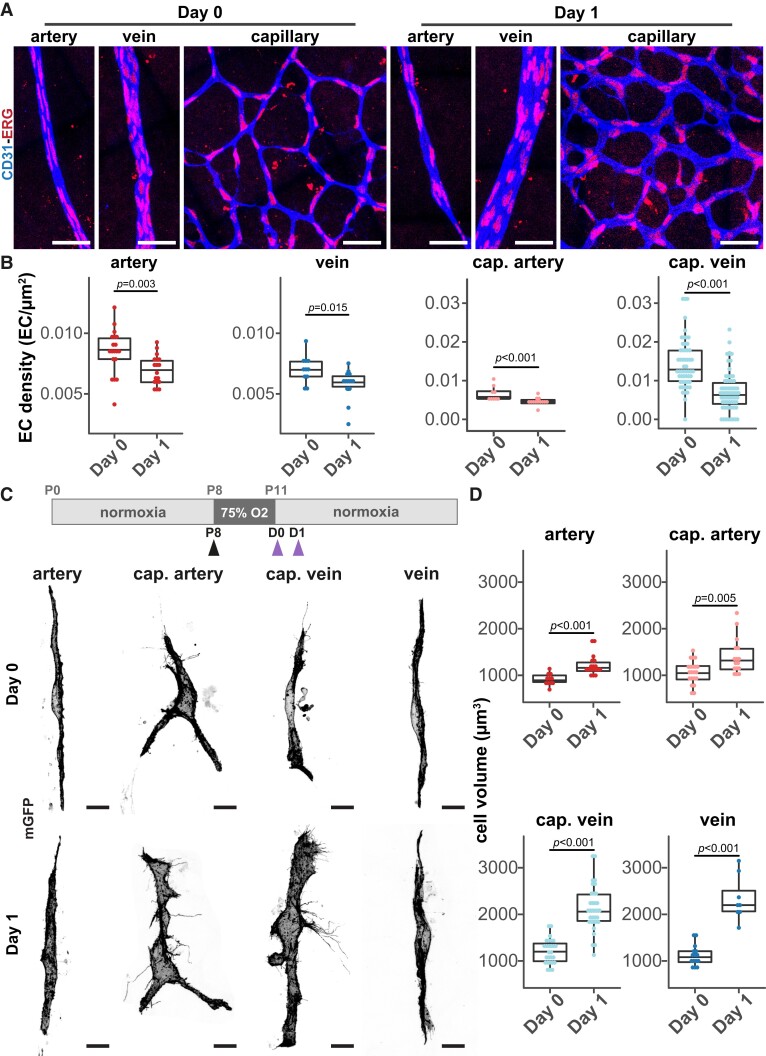
EC volume and venule diameter increases precede AV shunt development. (A) Representative images of EC nuclei (ERG, red) distribution within artery, vein, and capillary at Day 0 and Day 1 (CD31, blue). Scale bar: 50 µm. (B) Quantification of EC density in arteries, veins, arterial capillaries, and venous capillaries at Day 0 and Day 1. Each dot represents a vessel on Day 0 (4 pups) and Day 1 (5 pups). P-value from Mann–Whitney U test. (C) Top panel: schematic of experimental protocol for mosaic expression of mGFP in ECs. Black arrow: tamoxifen injection. Purple arrows: time of collection. Bottom panel: representative images of single ECs (mGFP, grey) in the artery, arterial capillary, venous capillary, and vein from mouse retinas at Day 0 and Day 1. Scale bar: 10 µm. (D) Quantification of EC volume in single cells in arteries, arterial capillaries, venous capillaries, and veins from mouse retinas at Day 0 and Day 1. Each dot represents an EC from Day 0 (11 artery, 21 cap. artery, 15 vein, and 25 cap. vein cells, 3 pups) and Day 1 (18 artery, 16 cap. artery, 8 vein, and 33 cap. vein cells, 3 pups). P-value from Mann–Whitney U test.

