Figure 6.
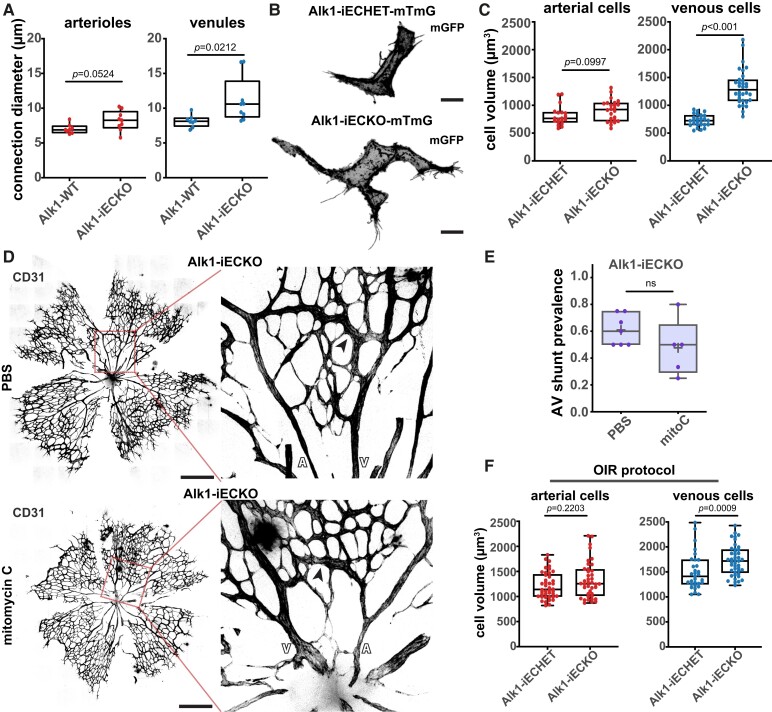
Alk1 signalling controls EC volume cell-autonomously. (A) Quantification of arteriole and venule diameter in Alk1-WT (19 arterial and 24 venous cells, 4 pups) and Alk1-iECKO (24 arterial and 32 venous cells,4 pups) retinas 72 h post-tamoxifen injection. Each dot represents a second-order vessel. P-value from Mann–Whitney U test. (B) Representative images of ECs from a venous capillary EC (GFP, grey) of Alk1.iECHET-mTmG and Alk1-iECKO-mTmG 24 h post-tamoxifen injection. Scale bar: 10 µm. (C) Quantification of EC volume in arterial (arteries and arterial capillaries) and venous (vein and venous capillaries) vessels from Alk1.iECHET-mTmG and Alk1-iECKO-mTmG 72 h post-tamoxifen injection. Each dot represents one EC from Alk1.iECHET-mTmG (3 pups) and Alk1-iECKO-mTmG (3 pups). P-value from Mann–Whitney test. (D) Representative images (left, overview; right, higher magnification of the AV shunt) from Alk1-iECKO late P5 retinas treated with PBS or mitomycin C stained for ECs (CD31, grey). Black arrows: AV shunts; A:, artery; V, vein. Scale bar: 500 µm. (E) Quantification of AV shunt prevalence at Day 3 in Alk1-iECKO late P5 retinas treated with PBS (52 AV sections, 7 pups) or mitomycin (34 AV section, 5 pups). Each dot represents a mouse retina. P-value from Mann–Whitney U test. (F) Quantification of EC volume in arterial (arteries and arterial capillaries) and venous (vein and venous capillaries) vessels from Alk1.iECHET-mTmG and Alk1-iECKO-mTmG at Day 2. Each dot represents one EC from Alk1.iECHET-mTmG (42 arterial and 31 venous cells, 4 pups) and Alk1-iECKO-mTmG (40 arterial and 43 venous cells, 4 pups).

