Figure 7.
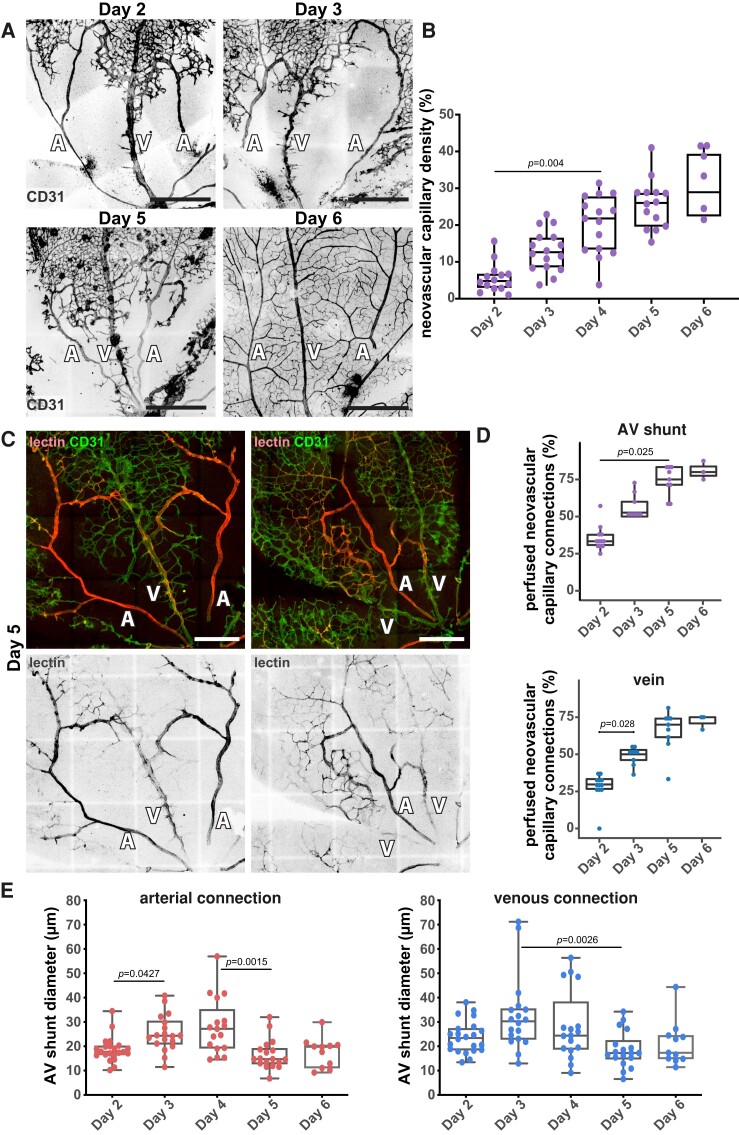
AV shunt regression associates with perfusion of the neo-capillaries. (A) Representative images of mouse retinas stained for CD31 (grey) at Day 2, Day 3, Day 5, and Day 6. A, artery; V: vein. Scale bar: 500 µm. (B) Quantification of neovascular capillary density between Day 2 and Day 6. Each dot represents an AV shunt proximal region from Day 2 (4 pups); Day 3 (3 pups); Day 4 (3 pups); Day 5 (4 pups); and Day 6 (3 pups). P-values from Kruskal–Wallis test and Dunn’s post hoc test using Benjamini–Hochberg correction for multiple comparisons. (C) Representative images of Day 5 mouse retinas perfused with lectin (red) and co-stained for ECs (CD31, green). A, artery; V, vein. Scale bar: 250 µm. (D) Quantification of perfused neovascular capillary connections to AV shunt (top) and associated vein (bottom) between Day 2 and Day 6. Each dot represents an AV shunt or a vein from Day 2 (6 retinas); Day 3 (4 retinas); Day 5 (5 retinas); and Day 6 (3 retinas). P-values from Kruskal–Wallis test with Dunn’s correction for multiple comparisons. (E) Quantification of AV shunt diameter on the first 50 µm connected to the corresponding artery (left) or vein (right) between Day 2 and Day 6 mouse retinas. Each dot represents an AV shunt from Day 2 (4 pups); Day 3 (3 pups); Day 4 (3 pups); Day 5 (4 pups); and Day 6 (3 pups). P-values from Kruskal–Wallis test and Dunn’s post hoc test using Benjamini–Hochberg correction for multiple comparisons.

