Figure 1.
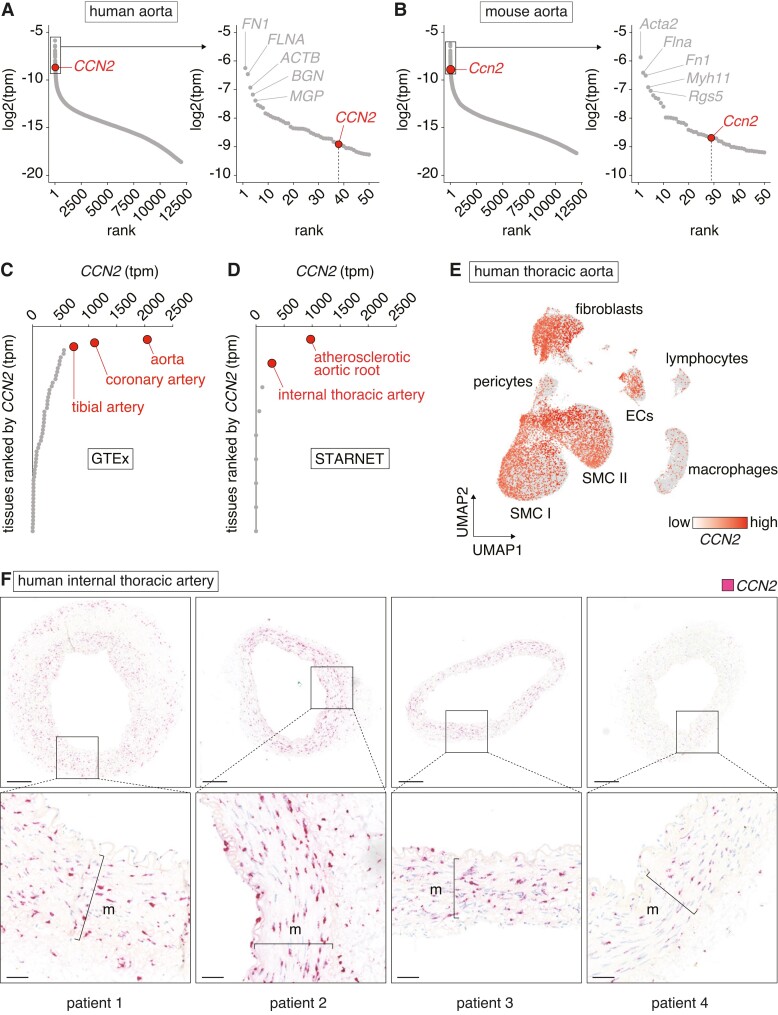
CCN2 is highly expressed in non-diseased artery tissues. (A, B) Genes ranked by expression level in aortas from humans (n = 432) (A) and mice (n = 4) (B). Dots represent median expression level for each gene. CCN2 is among the top 50 most abundant transcripts in both species (excluding mitochondrial genes). (C, D) CCN2 transcripts per million (tpm) across all tissues from the GTEx (C) and STARNET (D) databases. Dots represent median expression level in each tissue. Artery tissues are shown in red. Relative CCN2 expression was markedly elevated in human arteries compared with non-vascular tissues (E). UMAP plot based on single-nucleus RNA-seq data from non-lesioned human thoracic aortas (n = 6) overlaid with CCN2 expression. SMCs, fibroblasts, and endothelial cells express CCN2, while lymphocytes and macrophages displayed little to no CCN2 expression (F). CCN2 ISH of human internal thoracic arteries (n = 4). Most staining was observed in the medial layer. Refer to supplementary material online, Figure S2 for negative control ISH. Scale bars (overview) = 250 µm; scale bars (magnification) = 50 µm. m = media.

