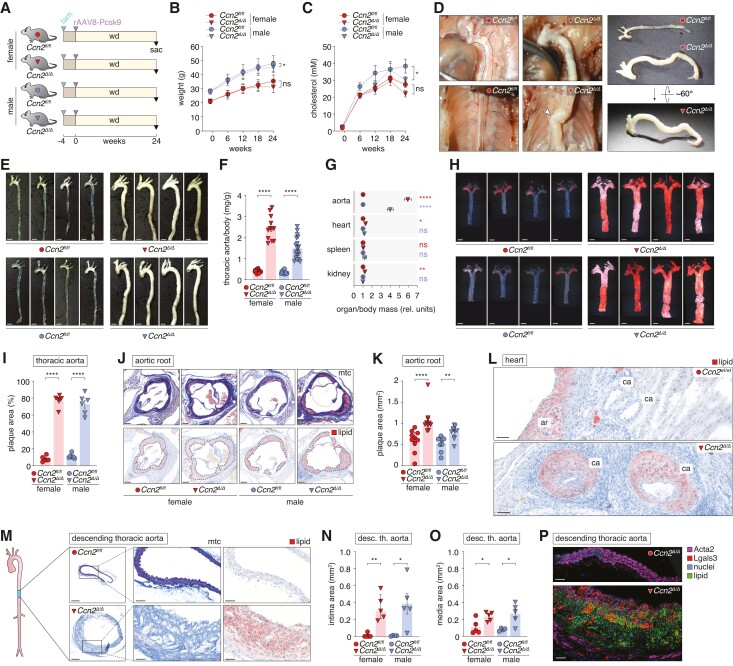
Figure 3.
Ccn2 deficiency causes severe atherosclerosis not limited to typical pre-dilection sites in hyperlipidaemic mice. (A) Experiment design (n = 14/12/10/19 for Ccn2fl/fl females, Ccn2Δ/Δ females, Ccn2fl/fl males, Ccn2Δ/Δ males, respectively, after excluding three mice that met the pre-specified humane endpoints (see supplementary material online, Figure S4B). (B, C). Mouse weight (B) and plasma cholesterol (C) through the course of the experiment. (D) In situ and ex vivo images of Ccn2fl/fl and Ccn2Δ/Δ aortas. While aortas of Ccn2fl/fl mice were aligned with the spine, the enlargement of aortas in Ccn2Δ/Δ mice hindered this and resulted in a consistently observed kink (arrowhead) at the level of the descending thoracic aorta. (E) Thoracic aortas after 24 weeks of hyperlipidaemia. Scale bars = 2.5 mm. (F) Mass of thoracic aortas relative to body weight after 24 weeks of hyperlipidaemia. The relative effect of the genotype was significantly higher in female mice. (G) Mass of the thoracic aorta, heart, spleen, and kidney (mean of two kidneys) relative to body weight. Each organ/body mass ratio is normalized to the mean of the female Ccn2fl/fl group for each organ to enable comparison of effects across the organs. (H) Oil Red O staining of en face-prepared thoracic aortas after 24 weeks of hyperlipidaemia. Scale bars = 2.5 mm. (I) Percentage of en face-prepared thoracic aorta area stained positive for lipid. We found no difference in the relative effect of genotype on this measure between female and male mice. (J, K) Cross-sections of aortic roots stained by Masson’s trichrome (mtc) and Oil Red O (scale bars = 100 µm, J) and quantitation of aortic root plaque area (K). The relative effect of the genotype was significantly higher in female mice. (L) Oil Red O staining showing atherosclerosis in coronary arteries (ca) near aortic roots (ar) from Ccn2Δ/Δ mice, which was not observed in Ccn2fl/fl mice. Scale bars = 50 µm. (M) Cross-sections of descending thoracic aortas stained by Masson’s trichrome (mtc) or Oil Red O. Scale bars (overview) = 200 µm; Scale bars (magnification) = 50 µm. (N, O) Intimal (N) and medial (O) cross-sectional area of descending thoracic aorta. We found no difference in the relative effect of genotype on these measures between female and male mice. (P) Immunofluorescence co-staining of descending thoracic aorta (adjacent to sections shown in M) for Acta2 (staining was performed with an Alexa Fluor 647-conjugated secondary antibody but shown in magenta), Lgals3 (red), lipid (green), and nuclei (blue). Scale bars = 50 µm. Some analyses shown on the figure were performed on randomly selected subsets from each group. Data in B and C were analysed by two-way ANOVA. Data in F, G, I, and K and N and O were analysed by unpaired t-test with Welch’s correction or Mann–Whitney U test.

