Figure 4.
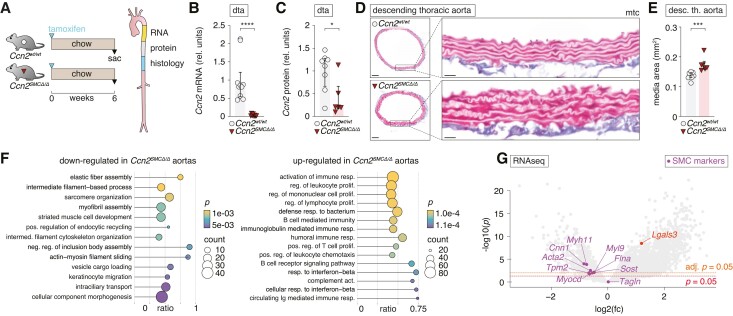
SMC-specific Ccn2 deletion recapitulates effects on SMC phenotype and medial expansion observed in global Ccn2 knockout mice. (A) Experiment design (resulting in data shown in B–G) and aorta segments used for RNA, protein, and histological analyses. (B, C) Ccn2 mRNA (B) and Ccn2 protein (C) level in descending thoracic aortas. dta, descending thoracic aorta. (D, E) Cross-sections of descending thoracic aortas stained by Masson’s trichrome (mtc) [scale bars (overview) = 100 µm; scale bars (magnification) = 20 µm] (D) and quantitation of the medial area (E). (F) GSEA based on RNA-seq of descending thoracic aorta from Ccn2SMCΔ/Δ (n = 7) and Ccn2wt/wt aortas (n = 8). The 15 most down- and up-regulated gene ontology biological process terms (based on significance) are shown. Dot sizes indicate the number of genes regulated in Ccn2SMCΔ/Δ aortas for each term. The ratio shows the coverage of a given term by genes regulated in Ccn2SMCΔ/Δ aortas, and dot colours indicate the level of significance. (G) Volcano plot showing regulation of all genes in Ccn2SMCΔ/Δ aortas. Two thousand four hundred eighty-seven (18.7%) genes were up-regulated and 139 (1%) genes were down-regulated (adjusted P < 0.05) in Ccn2SMCΔ/Δ aortas (see supplementary material online, Table S2). Myocd and genes encoding pre-specified markers for contractile SMCs are shown in magenta, and Lgals3 is shown in red. Data in B and C and E were analysed by unpaired t-test with Welch’s correction or Mann–Whitney U test. Data in F were analysed using clusterProfiler 4.0 package41 in R.

