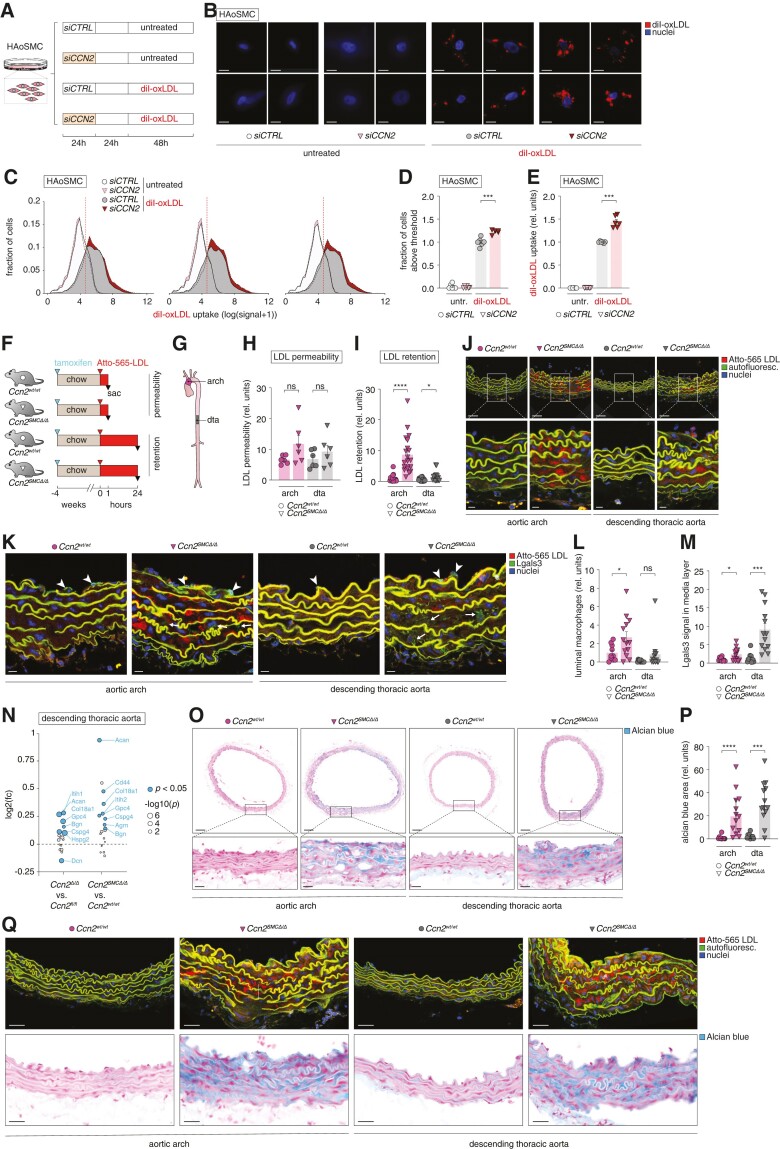
Figure 6.
Ccn2 deficiency augments the capacity of medial extracellular matrix to retain LDL. (A) Experiment design (resulting in data shown in B–E). The experiment was replicated three independent times obtaining similar results. (B) Images of CCN2-silenced and control HAoSMCs either untreated or treated with diI-conjugated oxidized LDL (diI-oxLDL, red) and nuclei were stained with DAPI (blue). Scale bars = 5 µm. (C–E) Histograms showing three examples of flow cytometry data from the four experimental groups (C); quantitation of proportion of HAoSMCs with an oxLDL uptake above the defined cut-off (vertical red dotted line in C) (D) and the mean uptake for this population (E). (F, G) Experiment design (n = 6/6 for chow-fed Ccn2wt/wt and Ccn2SMCΔ/Δ mice used for investigation of endothelial permeability to LDL, and n = 15/20 for chow-fed Ccn2wt/wt and Ccn2SMCΔ/Δ mice used for investigation of LDL retention) (F) and aorta segments used for analyses in H–Q (G). dta, descending thoracic aorta. (H–J) Atto-565 LDL signal in the aortic arch and dta 1 h (H) and 24 h (I) after injection as quantified based on confocal fluorescence microscopy images shown for the 24-h time point in J. Scale bars (top) = 50 µm; scale bars (magnification) = 10 µm. (K) Sections adjacent to those analysed in H–J were stained for Lgals3 by immunofluorescence. Arrowheads point to endothelium-associated luminal macrophages (high level of dense Lgals3 signal), whereas arrows point to more diffuse and low levels of Lgals3 staining in the medial layer (presumed to be modulated SMCs). Scale bars = 10 µm. (L, M) Quantitation of endothelium-associated luminal Lgals3-positive macrophages (L) and medial Lgals3 signal (M) based on Lgals3 stainings represented in K. (N) Effect of global and SMC-specific Ccn2 knockout on the level of aortic proteoglycans (defined previously1) as assessed by mass spectrometry (full data sets are provided in supplementary material online, Tables S3 and S4). Blue dots show significantly regulated proteins, and dot size corresponds to the level of significance. Identities of all significantly regulated proteoglycans are shown. (O, P) Alcian blue staining of sections adjacent to those shown in J and K (O), and quantitation of Alcian blue-positive area (P). Scale bars (top) = 100 µm; scale bars (magnification) = 25 µm. (Q) Comparison of Atto-565 LDL signal (from analysis in H–J) and Alcian blue staining (from analysis in O and P). Scale bars = 25 µm. Data in D, E, H, I, L, M, and P were analysed by unpaired t-test with Welch’s correction or Mann–Whitney U test.

