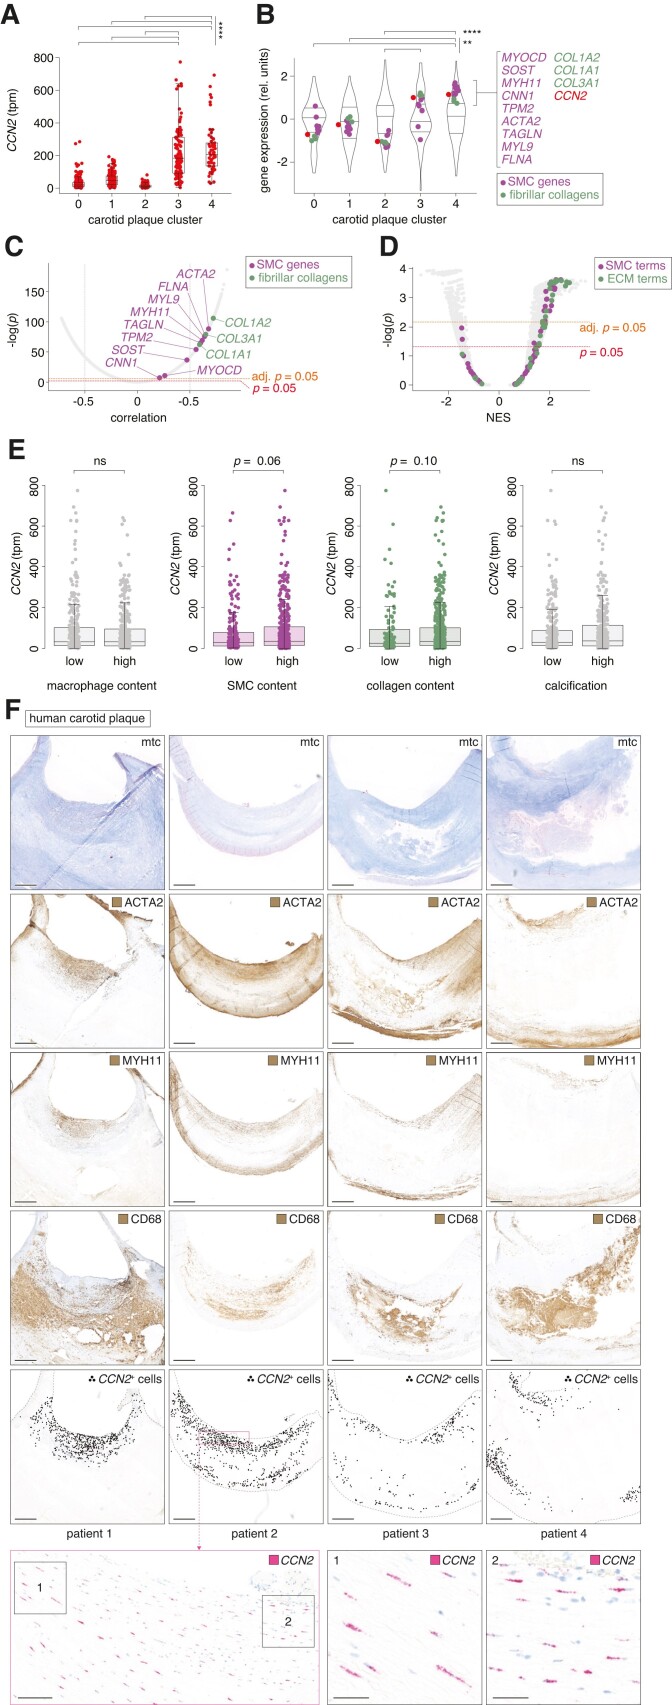
Figure 7.
CCN2 expression correlates with SMC markers in advanced human plaques. (A) CCN2 transcripts per million (tpm) in carotid plaques from the Athero-Express study cohort42–45 (n = 654) divided into five transcriptome-based plaque clusters as previously described.42 Data are shown as median and interquartile range. (B) Gene expression in the five transcriptome-based plaque clusters from the Athero-Express study cohort. MYOCD and genes encoding pre-specified markers for contractile SMCs are shown in magenta, while genes encoding fibrillar collagens are shown in green. CCN2 is shown in red. The distribution of gene expression for all measured transcripts is represented as violin plots. Expression values are scaled per cluster. (C) Correlation of CCN2 with any other gene across the 654 carotid plaques from the Athero-Express study cohort. MYOCD and genes encoding pre-specified markers for contractile SMCs are shown in magenta, while genes encoding fibrillar collagens are shown in green. (D) GSEA based on genes ranked by correlation to CCN2 (as shown in C). Terms related to SMCs are shown in magenta, while terms related to extracellular matrix (ECM) is shown in green. (E) Associations between CCN2 expression level and human carotid plaque content of macrophages, ACTA2+ SMCs, collagen, and calcification, respectively, semi-quantitatively divided into low and high levels of each histologically assessed parameter. The data are based on the Athero-Express study cohort (n = 654). (F) CCN2, ACTA2, MYH11, and CD68 expression in human carotid plaques (n = 4) from the Odense Artery Biobank by ISH and immunohistochemistry, respectively. CCN2-positive cells are marked with black dots to assist visualization of CCN2+ cell distribution at low magnification. Scale bars (overview) = 1 mm. Scale bars (magnification levels) = 100 and 25 µm, respectively. Mtc, Masson’s trichrome. Data in A and B were analysed by Kruskal–Wallis test followed by Dunn’s multiple comparisons test. Data in C were analysed by Pearson correlation significance test and Bonferroni adjusted for multiple testing. Data in D were analysed using clusterProfiler 4.0 package41 in R. Data in E were analysed by Wilcoxon rank-sum test.

