Figure 3.
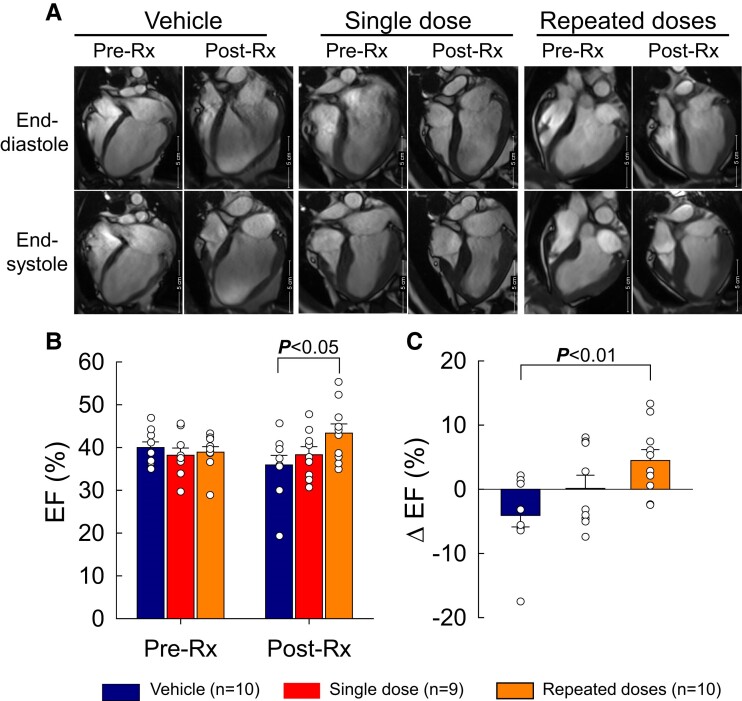
LV function (EF) assessed by MRI. (A) Representative four-chamber views at end-systole and end-diastole from vehicle-, single-dose-, and repeated-dose-treated pigs at 30 days after MI (before the 1st treatment, pre-Rx) and at 105 days after the 1st treatment (immediately before euthanasia, post-Rx). (B) LV EF at pre-Rx and post-Rx. (C) Δ EF at post-Rx vs. pre-Rx. Open circles represent individual pigs and bars/whiskers mean ± S.e.m. P values shown for absolute EF values (two-way repeated-measures ANOVA followed by Bonferroni multiple comparison tests, n = 9/10) and for Δ EF (one-way ANOVA followed by Bonferroni t-tests, n = 9/10).

