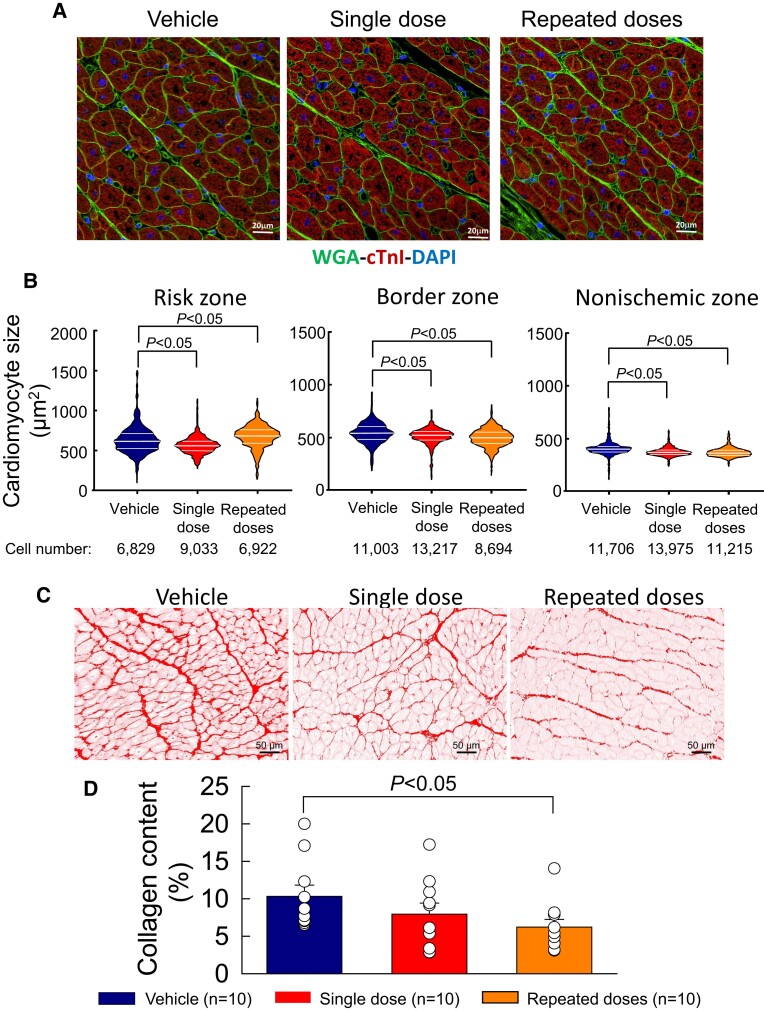
Figure 6.
Cardiomyocyte size and myocardial collagen content. (A) Representative images of LV myocardium in the non-ischaemic region stained with WGA, cTnI, and DAPI from vehicle-, single-dose-, and repeated-dose-treated pigs. (B) Violin plot analysis comparing the distribution of cardiomyocyte cross-sectional area in the risk zone (left panel), border zone (middle panel), and non-ischaemic zone (right panel). Cell number is the total number of cells used for each plot from the 10 animals of each group. (C) Representative colour deconvoluted images of myocardium stained with Picrosirius red in the non-ischaemic LV region of vehicle-, single-dose-, and repeated-dose-treated pigs. (D) Collagen content measured as Picrosirius red positive area, expressed as a percentage of total measured area. Open circles represent individual pigs and bars/whiskers mean ± S.e.m. P values shown for cross-sectional area (Kruskal–Wallis one-way ANOVA on ranks followed by Dunn's all pairwise multiple comparison tests using cell numbers ranging from 6829 to 13 975 from n = 10) and for collagen content (one-way ANOVA followed by Bonferroni t-tests, n = 10).

