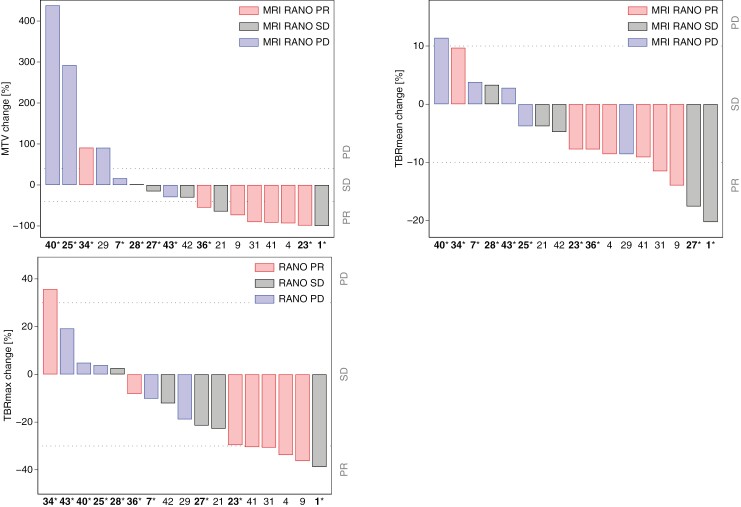
Figure 3.
Waterfall plots of [18F]FET response metrics. Each bar shows percent change in MTV (A), in TBRmean (B), and TBRmax (C) of individual patients with [18F]FET also at follow-up. Dotted lines show PET RANO upper and lower limits for stable disease (SD). Bars are color coded according to MRI RANO response. Subject ID is shown below with font color indicating responder (OS > 11 months) or nonresponder (OS < 11 months, marked with asterisk). Patients #25 and #29 did not fulfill RANO criteria for contrast-enhancing measurable lesions at baseline. PR, partial response; PD, progressive disease; OS, overall survival.

