Figure 1.
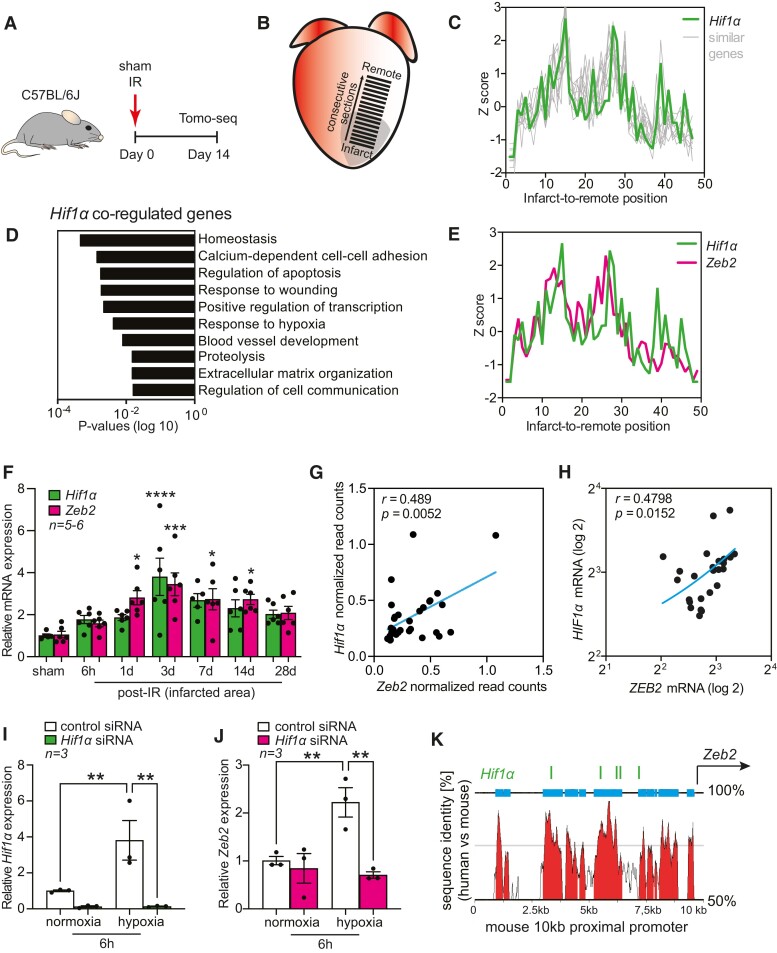
Zeb2 is induced by HIF1α in hypoxic cardiomyocytes. (A) Study design. (B) Tomo-seq on infarcted mouse heart. (C) Spatial expression traces of Hif1α and similarly regulated genes in mouse hearts 14 days post-injury. (D) Gene Ontology analysis showing enriched pathways of Hif1α co-regulated genes. (E) Spatial expression traces of Hif1α and Zeb2 in the infarcted mouse heart. (F) qPCR analysis of Hif1α and Zeb2 expression levels in mouse hearts collected at different time points after IR. (G–H) Pearson correlation between Hif1α and Zeb2 expression in (G) single cardiomyocytes isolated from injured mouse hearts and (H) human ischaemic hearts. (I and J) qPCR analysis of (I) Hif1α and (J) Zeb2 expression levels following Hif1α knock-down in NRCMs. (K) UCSC Genome Browser annotation of the 10 kb proximal promoter region of Zeb2 showing multiple conserved HREs. n (biological replicates) is indicated in the figures. Data are represented as mean ± SEM, *P < 0.05, **P < 0.01, and ***P < 0.001 compared to control (corresponding sham or normoxia) using one-way ANOVA followed by Dunnett’s multiple comparison test (F) or unpaired, two-tailed Student’s t-test (I and J). NRCMs, neonatal rat cardiomyocytes; HRE, hypoxia-responsive elements.

