Figure 3.
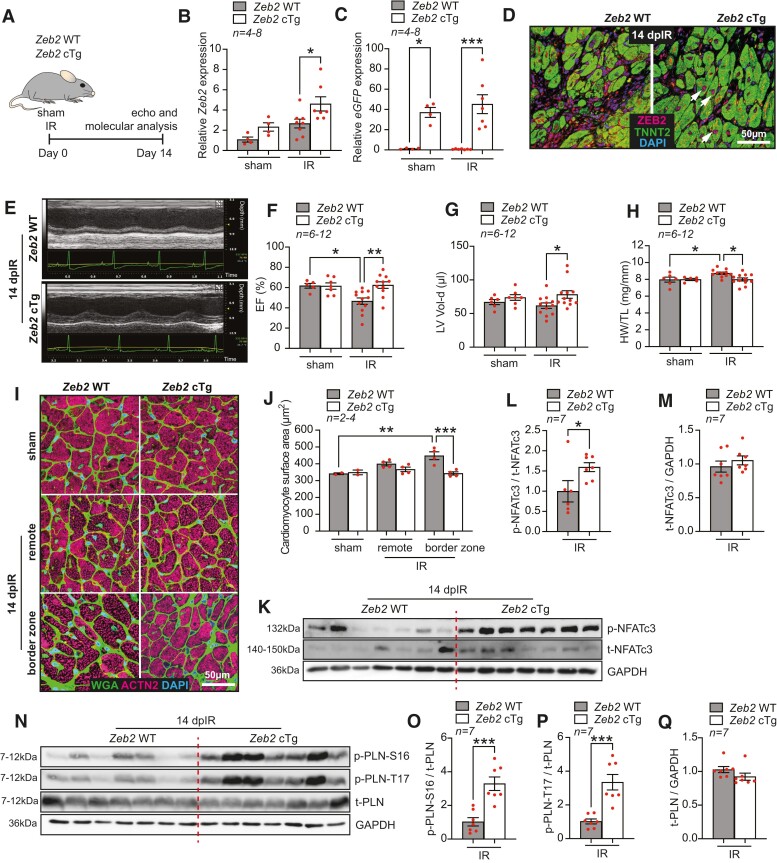
Cardiomyocyte-specific ZEB2 overexpression protects from ischaemia-induced pathological hypertrophy and contractile dysfunction. (A) Study design. (B and C) qPCR analysis of (B) Zeb2 and (C) eGFP (Ct values) in the hearts from Zeb2 WT and Zeb2 cTg mice post sham or IR surgeries. (D) Representative immunofluorescence staining of ZEB2 and TNNT2 in the hearts from Zeb2 WT and Zeb2 cTg mice 14 days post-IR (dpIR). (E) Representative M-mode images of Zeb2 WT and Zeb2 cTg mice 14 dpIR. (F–H) Quantification of (F) ejection fraction (EF), (G) left ventricular volume in diastole (LV Vol-d), and (H) heart weight to tibia length (HW/TL) ratio in Zeb2 WT and Zeb2 cTg mice post-surgery. (I) WGA staining to show cardiomyocyte surface area and (J) its quantification. (K–Q) Western blot analysis of (K and N) the indicated proteins and (L, M, and O–Q) their quantification in Zeb2 WT and Zeb2 cTg mice 14 dpIR. n (biological replicates) is indicated in the figures. White arrows show ZEB2-positive cardiomyocytes. Data are represented as mean ± SEM, *P < 0.05, **P < 0.01, and ***P < 0.001 using one-way ANOVA followed by Sidak’s multiple comparison test (B, C, F, G, and H), compared to sham using one-way ANOVA followed by Dunnett’s multiple comparison test (J) or compared to Zeb2 WT using unpaired, two-tailed Student’s t-test (L, M, O, P, and Q).

