Figure 5.
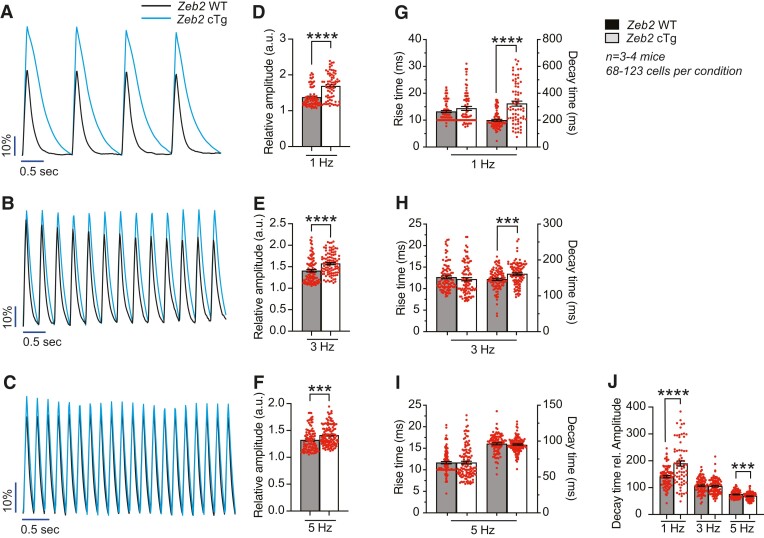
ZEB2 overexpression improves Ca2+ handling in cardiomyocytes after injury. (A–C) Representative analysis of Ca2+ transients in cardiomyocytes isolated from Zeb2 WT and Zeb2 cTg mice 14 days post-IR (dpIR) exposed to a Ca2+-sensitive dye after different stimulation frequencies. (D–F) Quantification of relative Ca2+ transient amplitude. (G–I) Quantification of rise time, defined as the time from baseline to transient peak, and decay time, defined as the time from the transient peak back to baseline. (J) Quantification of decay time related to amplitude. n (biological replicates) is indicated in the figures. Data are represented as mean ± SEM, ***P < 0.001, and ****P < 0.0001 compared to Zeb2 WT using unpaired, two-tailed Student’s t-test (D, E, F, G, H, I, and J).

