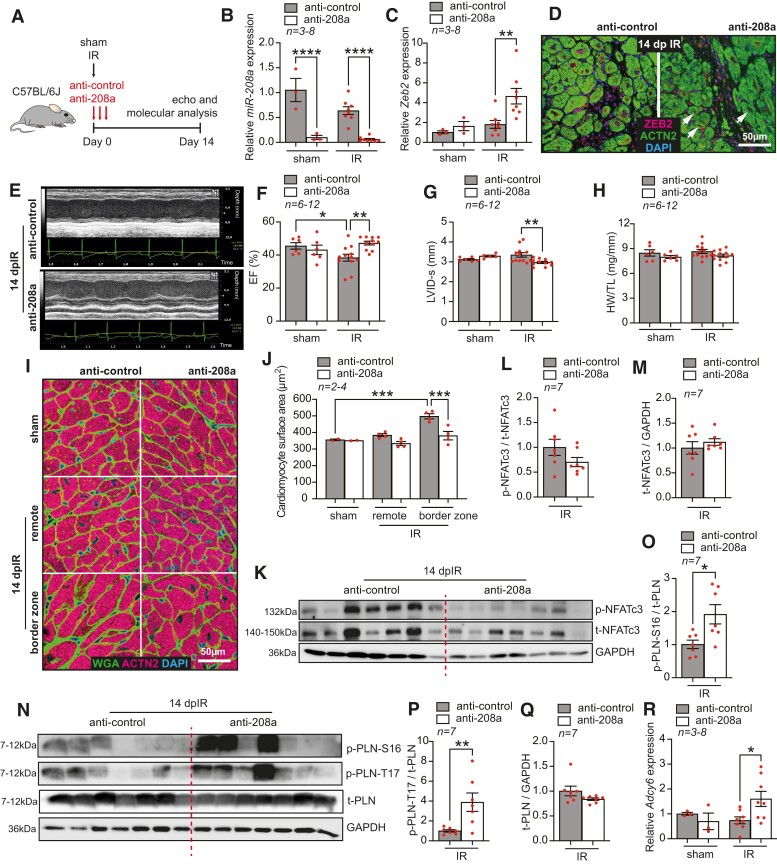
Figure 6.
miR-208a inhibition increases ZEB2 levels and improves cardiac function post-injury. (A) Study design. (B–C) qPCR analysis of (B) miR-208a and (C) Zeb2 in WT mouse hearts treated with anti-control or anti-208a subjected to sham or IR surgeries. (D) Representative immunofluorescence staining of ZEB2 and ACTN2 in mouse hearts treated with anti-control or anti-208a 14 days post-IR (dpIR). (E) Representative M-mode images of hearts from mice treated with anti-control or anti-208a 14 dpIR. (F–H) Quantification of (F) ejection fraction (EF), (G) left ventricular internal diameter in systole (LVID-s), and (H) heart weight to tibia length (HW/TL) ratio in mice treated with anti-control or anti-208a. (I) WGA staining to show cardiomyocyte surface area and (J) its quantification. (K–Q) Western blot analysis of (K and N) the indicated proteins and (L, M, and O–Q) their quantification in hearts from WT mice treated with anti-control or anti-208a 14 dpIR. (R) qPCR analysis of Adcy6 expression in anti-control or anti-208a-treated mice 14 days post-surgery. n (biological replicates) is indicated in the figures. White arrows show ZEB2-positive cardiomyocytes. Data are represented as mean ± SEM, *P < 0.05, **P < 0.01, and ***P < 0.001 using one-way ANOVA followed by Sidak’s multiple comparison test (B, C, F, G, H, and R), compared to sham using one-way ANOVA followed by Dunnett’s multiple comparison test (J) or compared to anti-208a-treated IR group using unpaired, two-tailed Student’s t-test (L, M, O, P, Q, S, and T).

