Figure 2.
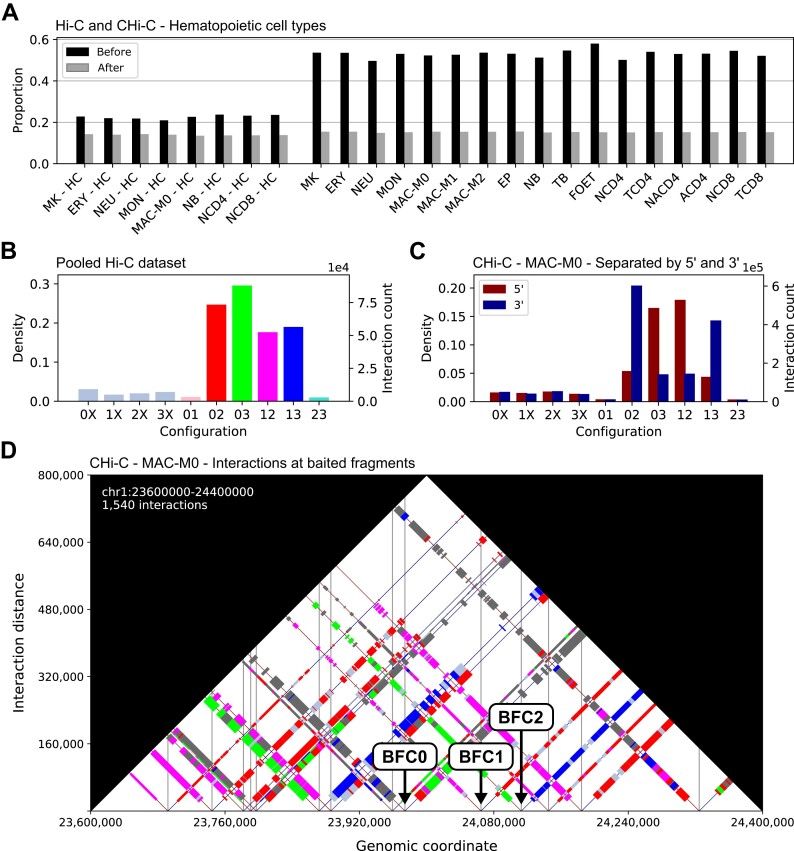
Unbalanced interactions and their configurations. (A) Proportions of unbalanced interactions before and after randomization for Hi-C experiments on eight and CHi-C experiments on 17 hematopoietic cell types. For this plot, we used a threshold of 0.05 to classify interactions as unbalanced or balanced. (B) Distribution of unbalanced interactions selcted at an FDR threshold of 5% across the 10 configurations for the Hi-C dataset for which we pooled interactions across eight hematopoietic cell types and (C) the CHi-C dataset for the cell type MAC-M0. For CHi-C, we additionally distinguished interactions based on whether they go from a baited fragment toward 5′ or 3′. (D) Visualization of configurations of interactions at baited fragments in a selected region on chromosome 1 for cell type MAC-M0. Balanced interactions are represented by gray rectangles and the rectangles for unbalanced interactions are colored according to their configuration. Vertical lines are drawn at the center positions of baited fragments. We identified two classes of baited fragments that can be distinguished based on their configuration patterns. For one class (BFC1) configurations 03 (green) and 13 (blue) predominate and for the other class (BFC2) configurations 12 (magenta) and 02 (red) predominate. We assign baited fragments that do not exhibit either pattern to class BFC0.

