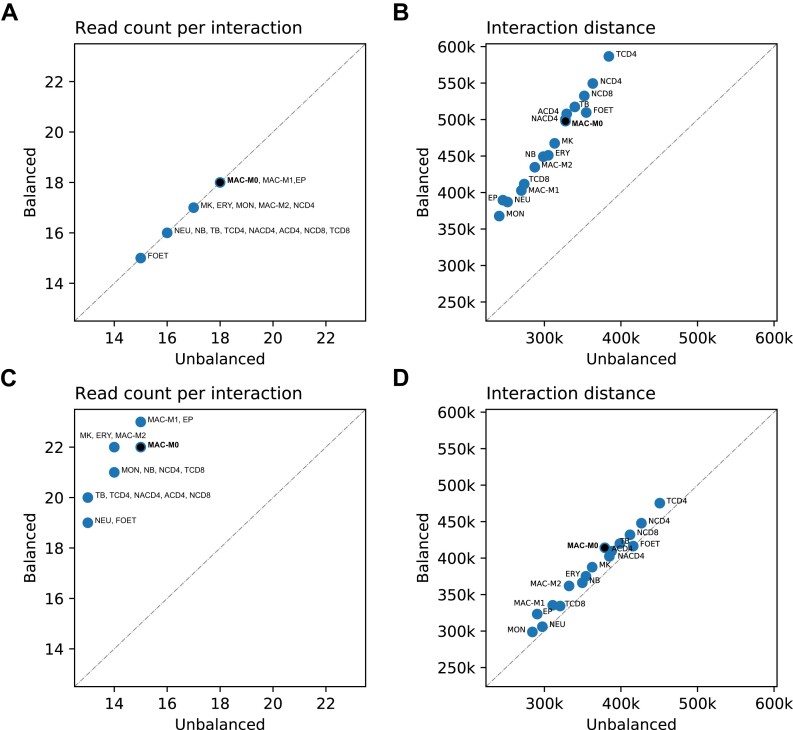
Figure 6.
Median total read pair counts and distances of interactions for 17 hematopoietic cell types. Median read pair counts per interaction and the median interaction distances for the 17 hematopoietic cell types. For the cell type MAC-M0, the medians correspond to those shown in Figure 5 at the top right of each histogram. (A) Median read pair counts per interaction for the two comparison sets of balanced and unbalanced interactions selected based on identical total read pair counts per interaction. (B) Corresponding median interaction distances. (C) Median read pair counts per interaction for the two comparison sets of balanced and unbalanced interactions selected based on identical maximum read pair counts. (D) Corresponding median interaction distances.

