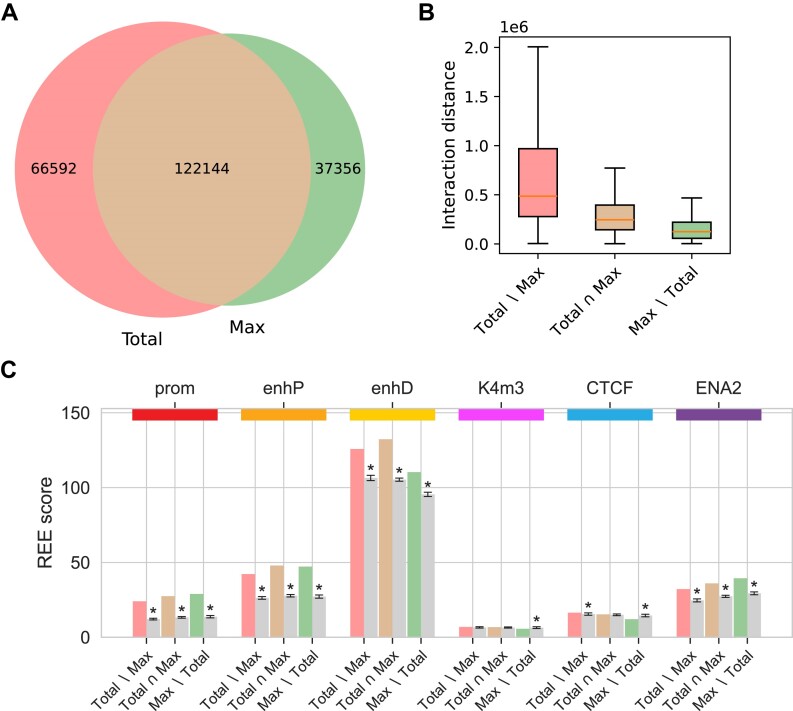
Figure 7.
) Venn diagram of identified interactions. ( Interactions for the MAC-M0 cell type identified using CHiCAGO with default parameters and a score threshold of 5, based either on total or maximum counts. (A) Venn diagram of identified interactions. (B) Distances of interactions identified based on total counts only, both total and maximum counts, and maximum counts only. (C) Enrichment of interaction other-ends for ENCODE’s Candidate Cis-Regulatory Elements promoters (prom), proximal enhancers (enhP), distal enhancers (enhD), DNase-H3K4me3 (K4m3) and CTCF sites, as well as for enhancers from the Enhancer Atlas 2.0 (ENA2). The REE scores represent the number of other-ends of a given interaction subset that contain at least one regulatory element of a given category, normalized to the total length of all other-ends. The gray bars correspond to the mean REE score obtained after randomization of the other-ends (‘Materials and methods’ section). REE scores that are three standard deviations above or below the mean are considered significant and marked with an asterisk. The unnormalized values from the randomization procedure used to calculate the REE scores are shown in Supplementary Table S10.

