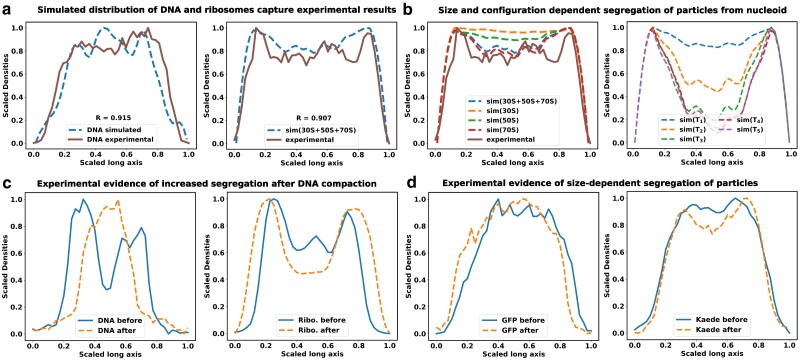
Fig. 2.
Size-dependent spatial distribution of cytoplasmic particles. The figure shows the linear density profiles of DNA and ribosomal subunits a) Here, solid lines correspond to experimental data, while dashed lines represent simulated densities. The R value denotes the Pearson correlation coefficient between the experimental and simulated data. The experimental linear density data have been adapted from reference (12). b) Species-specific segregation various ribosome moities are shown in comparison with the total ribosomes (left). Polysomes (70S) are more segregated from the nucleoid, compared to the individual 30S and 50s subunits. Figures (b-right) depicts the linear density profiles of tracer particles with respect to the nucleoid. Similar to ribosomes, large tracer particles also exhibit noticeable segregation from the nucleoid, with the extent of this segregation being contingent on their respective sizes. c) Density profiles of DNA and ribosomes along the long axis of the cell are computed from images of corresponding fluorescently tagged stains. Blue solid line refers to the distributions in untreated cells, while the orange dashed lines refer to distributions after treatment with translation-inhibiting drug chloramphenicol. The extent of segregation of ribosomes from the nucleoid increases after the chloramphenicol induced nucleoid compaction. d) Distribution of fluorescence signal from GFP and Kaede are compared with and without chloramphenicol treatment. Distribution of Kaede signal shows moderate segregation from nucleoid after nucleoid compaction, while the distribution for GFPs remain unchanged.

