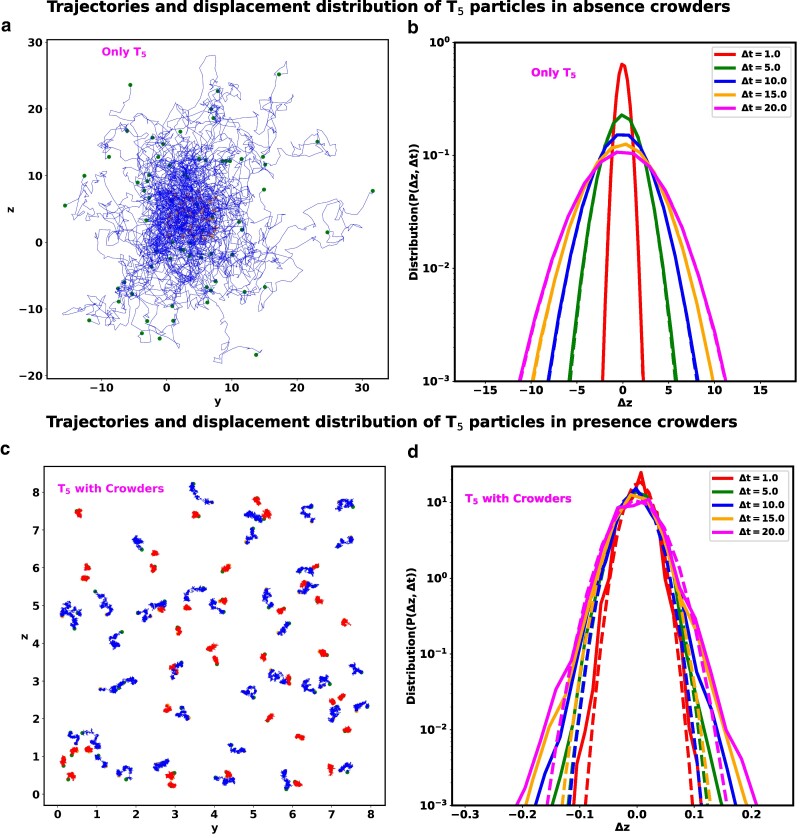
Fig. 4.
Comparison of Dynamic heterogeneity (DH) and non-Gaussian distribution between particle. a) The trajectory of particles in the absence of crowders. Each trajectory spans the same time period . These particles move more quickly and uniformly, filling up more of the cytoplasm. b) Distribution of displacement for with different delay times in the absence of crowders. c) The trajectory of in the presence of crowders. Each trajectory of span the time period . However, from the variation of trajectory sizes of within the same time period, we can argue that there are co-existence of fast (blue) and slow (red) moving particles, supporting the strong indication of dynamic heterogeneity. d) Distribution of displacement for with different delay times in the presence of crowders. In all figures (a and c), the start and end points of the respective trajectories are denoted by magenta and green colored scatter points. In all plots of (b) and (d), the simulated data are represented by solid lines, while the fits of a Gaussian function are depicted by dotted lines.

