Fig. 5.
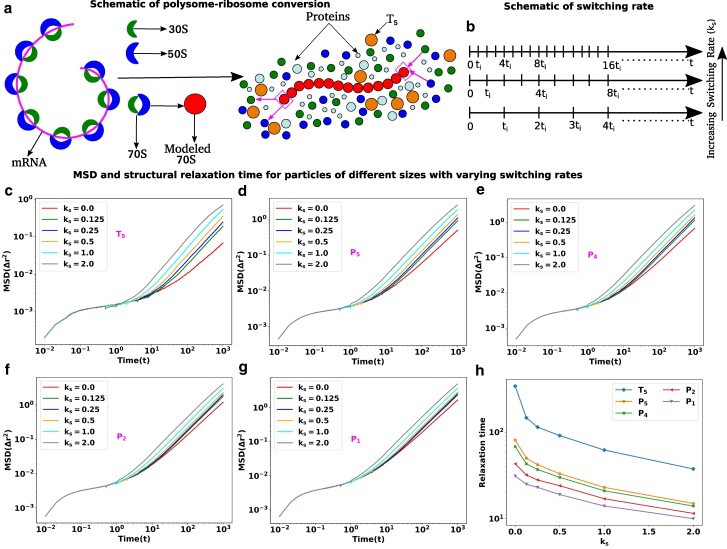
Translation activities can escalate the dynamics of cytoplasmic particles. a) Schematic representation of polysome–ribosome conversion. The magenta color thread represents the mRNA chain, with the ribosomal subunits located along its length. Two ribosomal subunits (30S and 50S) associate to create another subunit called 70S and polysome is the threads of 70S. The polysome–ribosome conversion has been modeled as follows: a 70S bead from one end of the polysome dissociates into two beads (30S and 50S) and two beads (30S and 50S) from the nearby region join to the other end by forming a single bead (70S). b) Schematic representation of switching rate. The entire trajectory is represented by the time , and in between switching happens at regular intervals of . The switching rate will increase if there are more switching occurrences within the same interval. MSD as a function of time with various switching rates for different sizes particles in descending order c) , d) , e) , f) and g) , respectively. For all the particles, the MSD curves are showing ballistic, diffusive, and caging regions which are the hallmarks of the glassy dynamics and the length of cages diminishes with the increase in switching rate. In contrast, for the smaller particles and , the switching effects are less prominent. h) Structural relaxation time ) as a function of switching rate for particles of different sizes.

