Fig. 4.
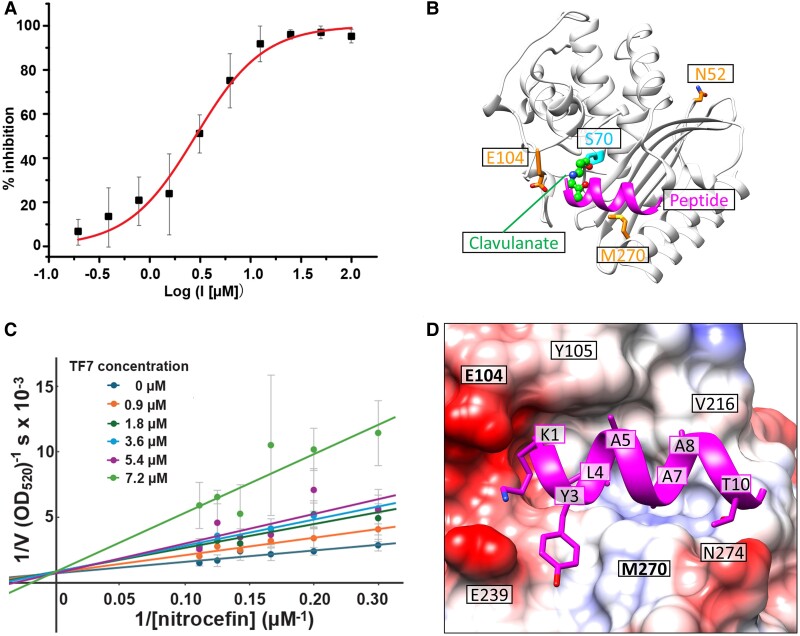
Experimental and modeling results of the peptide TF7 for the target protein, TEM-1. A) Inhibition curve of TF7 for the β-lactamase activity of TEM-1. B) The location of TF7 (colored magenta) bound to TEM-1. For comparison, the β-lactamase inhibitor, clavulanate (displayed in the stick and ball representation), is also displayed. Clavulanate is covalently attached to S70 of TEM-1. C) Lineweaver–Burk double reciprocal plot analysis depicting the TEM-1 inhibition kinetics by peptide TF7. A competitive inhibition mechanism was observed, as the 1/Vmax (Y-intercept) was unaffected under various peptide concentrations. D and E) Details of the interaction between TF7 and TEM-1. In (D), the peptide sidechains are shown in stick representation. TEM-1 is shown in surface representation with Coulombic surface coloring. Red regions are overall negatively charged, blue regions are overall positively charged, and white regions are hydrophobic. Figures presenting protein/peptide structures were prepared with UCSF Chimera (33).

