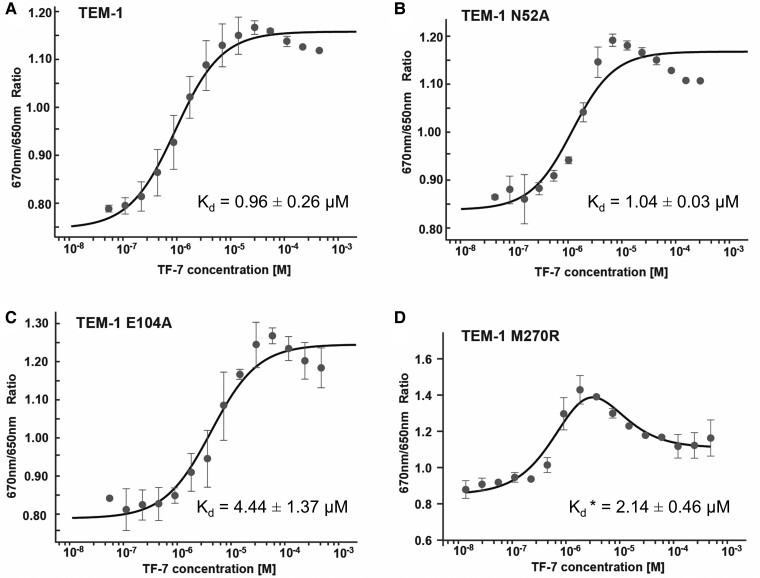
Fig. 5.
MST-binding curves of TEM-1 and mutants titrated with different concentrations of peptide TF7. A) TEM-1. B) TEM-1 N52A. C) TEM-1 E104A. D) TEM-1 M270R. The change in MST signal was fitted (black lines) to yield Kd values. The biphasic binding curve for TEM-1 M270R was analyzed as described in the Materials and methods section. Representative curves from three experiments are shown, with averages ± SD indicated. *M270R contains two TF7-binding sites. The Kd value of the site with stronger affinity is shown in (D), while the weaker affinity is 14.77 ± 12.96 µM.

