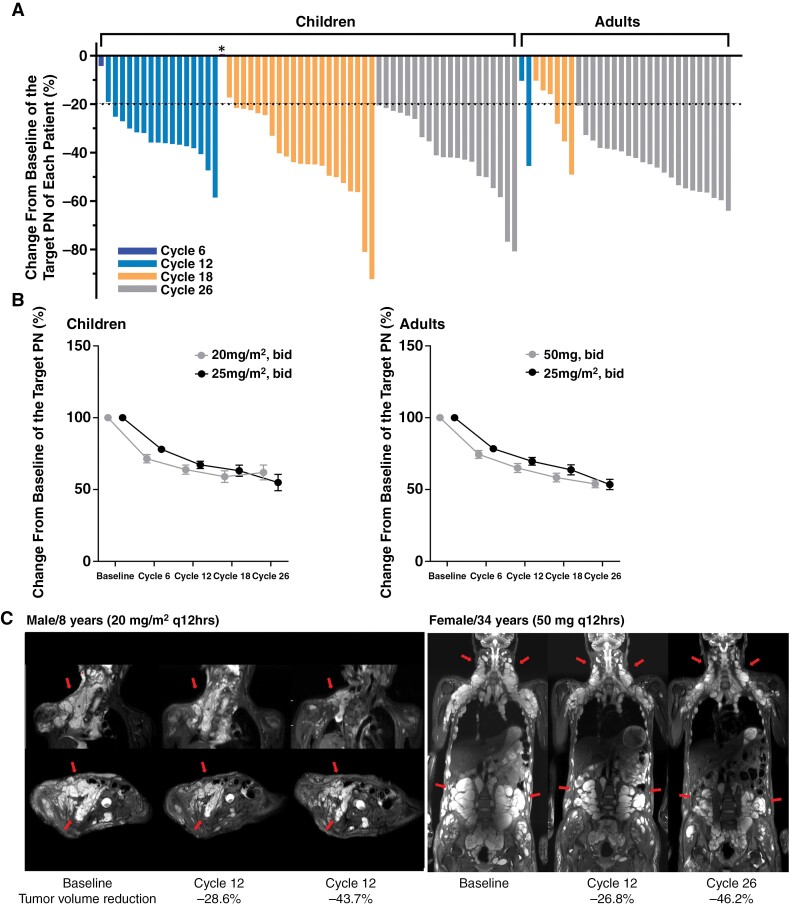
Figure 2.
Changes in tumor volume. (A) Percentage changes in the targeted tumor volume in each patient divided according to the number of cycles received. The dotted line denotes the threshold for partial response, which was defined as ≥20% reduction in tumor volume. *One child showed no response with an increased volume change of 0.7%. (B) Percentage changes in the targeted tumor volume in pediatric and adult patients according to the drug dosage. Each graph represents the mean and standard error of the means of each group. (C) Regular MRI scans of representative patients at baseline, cycle 12, and cycle 26. Left panel: an 8-year-old child in group 1. Right panel: a 34-year-old female 6 in group 3 (arrows, target lesion).

