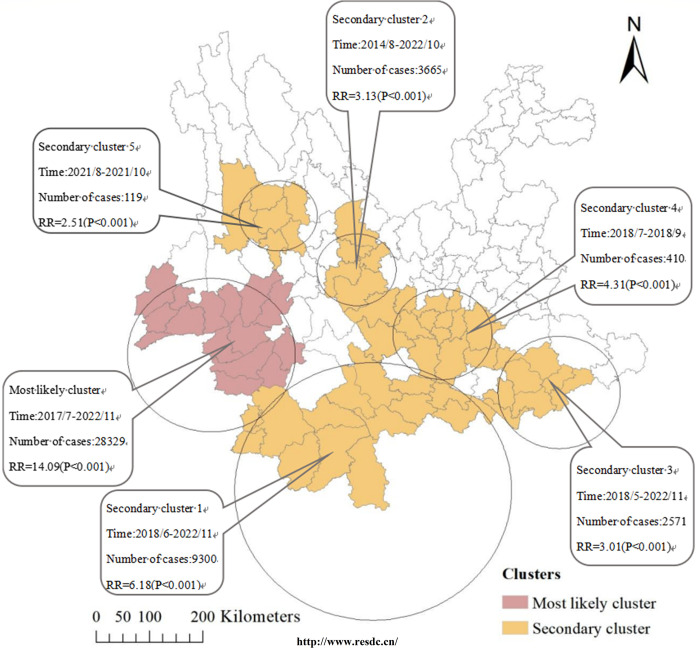
Fig 6. Spatiotemporal clusters of scrub typhus in Yunnan Province, 2006–2022.
Light redindicates the most likely high-risk spatiotemporal clustering area, orange indicates the secondary-risk clustering area. (The county-level map of Yunnan Province used in our study was obtained from the Chinese Academy of Sciences, Institute of Geographic Sciences and Natural Resources Research (http://www.resdc.cn/). This platform allows you to download the required base maps free of charge by registering as a user).

