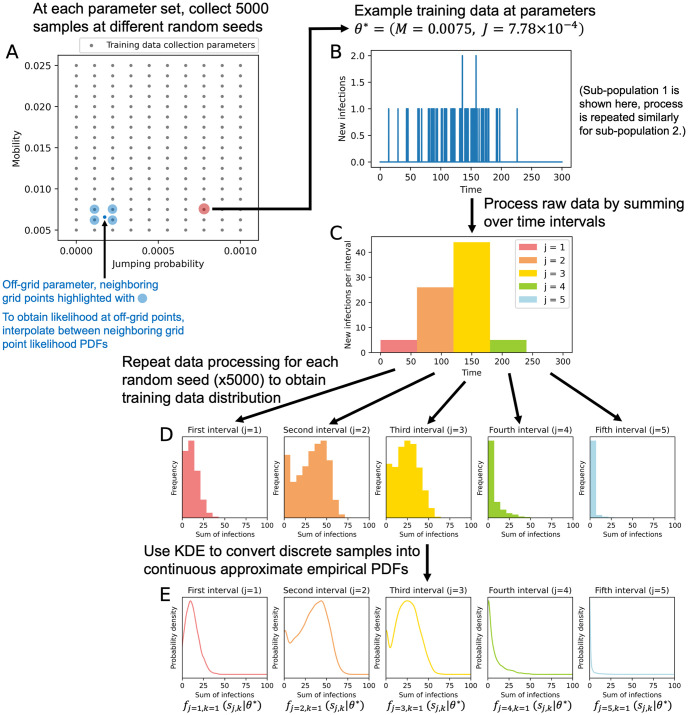
Fig 5. Diagram of approximate empirical PDF creation in the two-parameter case for sub-population 1.
(A) Training data sampling points. (B) Example training data sample. (C) Processed training data sample. (D) For each time interval, a histogram of total new infections across many samples. (E) Approximate empirical PDFs of total new infections for a given time interval, sub-population, and parameter set. The one-parameter case follows a similar process with jumping probability held constant at J = 0.

