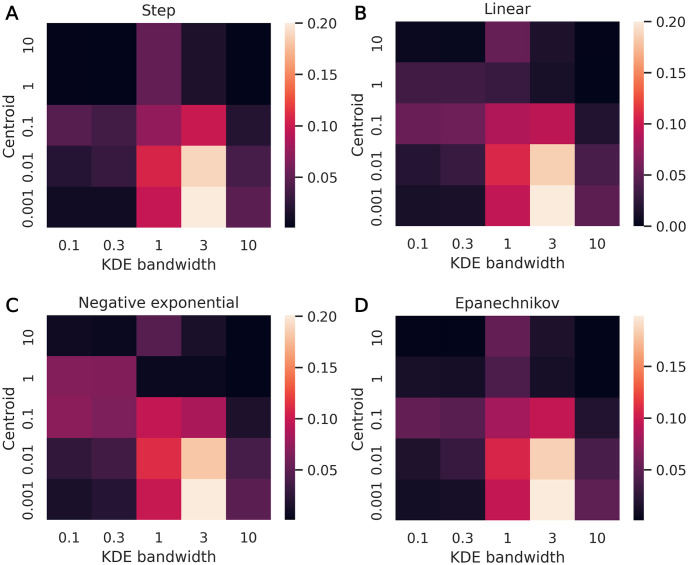
Fig 13. Calibration method 2 hyperparameter sweep results.
The colorbar represents the absolute difference between 0.5 and the fraction of “true” mobility values that fell within their respective 50% credible intervals, shown across a range of KDE bandwidths and centroids. Weight function shapes are (A) step, (B) linear, (C) negative exponential, (D) Epanechnikov.

