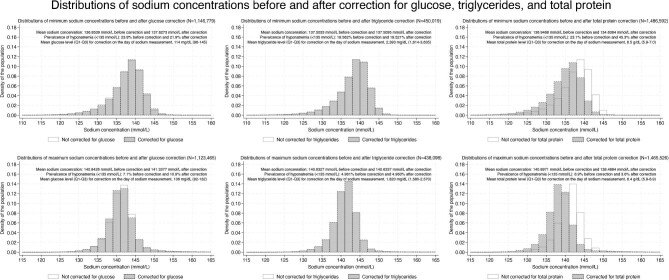
Figure 3:
Histograms showing sodium concentrations for minimum (upper panels) and maximum values (lower panels) with and without corrections for glucose (left panels), triglycerides (center panels), and total protein (right panels). In each panel, mean sodium levels, the prevalence of hyponatremia (sodium <135 mmol/l, upper panels) or hypernatremia (sodium >145 mmol/l, lower panels) before and after corrections, and mean concentrations of glucose, triglycerides, and total protein used for corrections are described in right upper areas. Note that for the triglyceride correction, due to a smaller sample size, prevalence is shown with more significant figures for accuracy.

