
Figure 4. CD8 TE Crawl along Liver Sinusoids until Hepatocellular Ags Are Recognized.
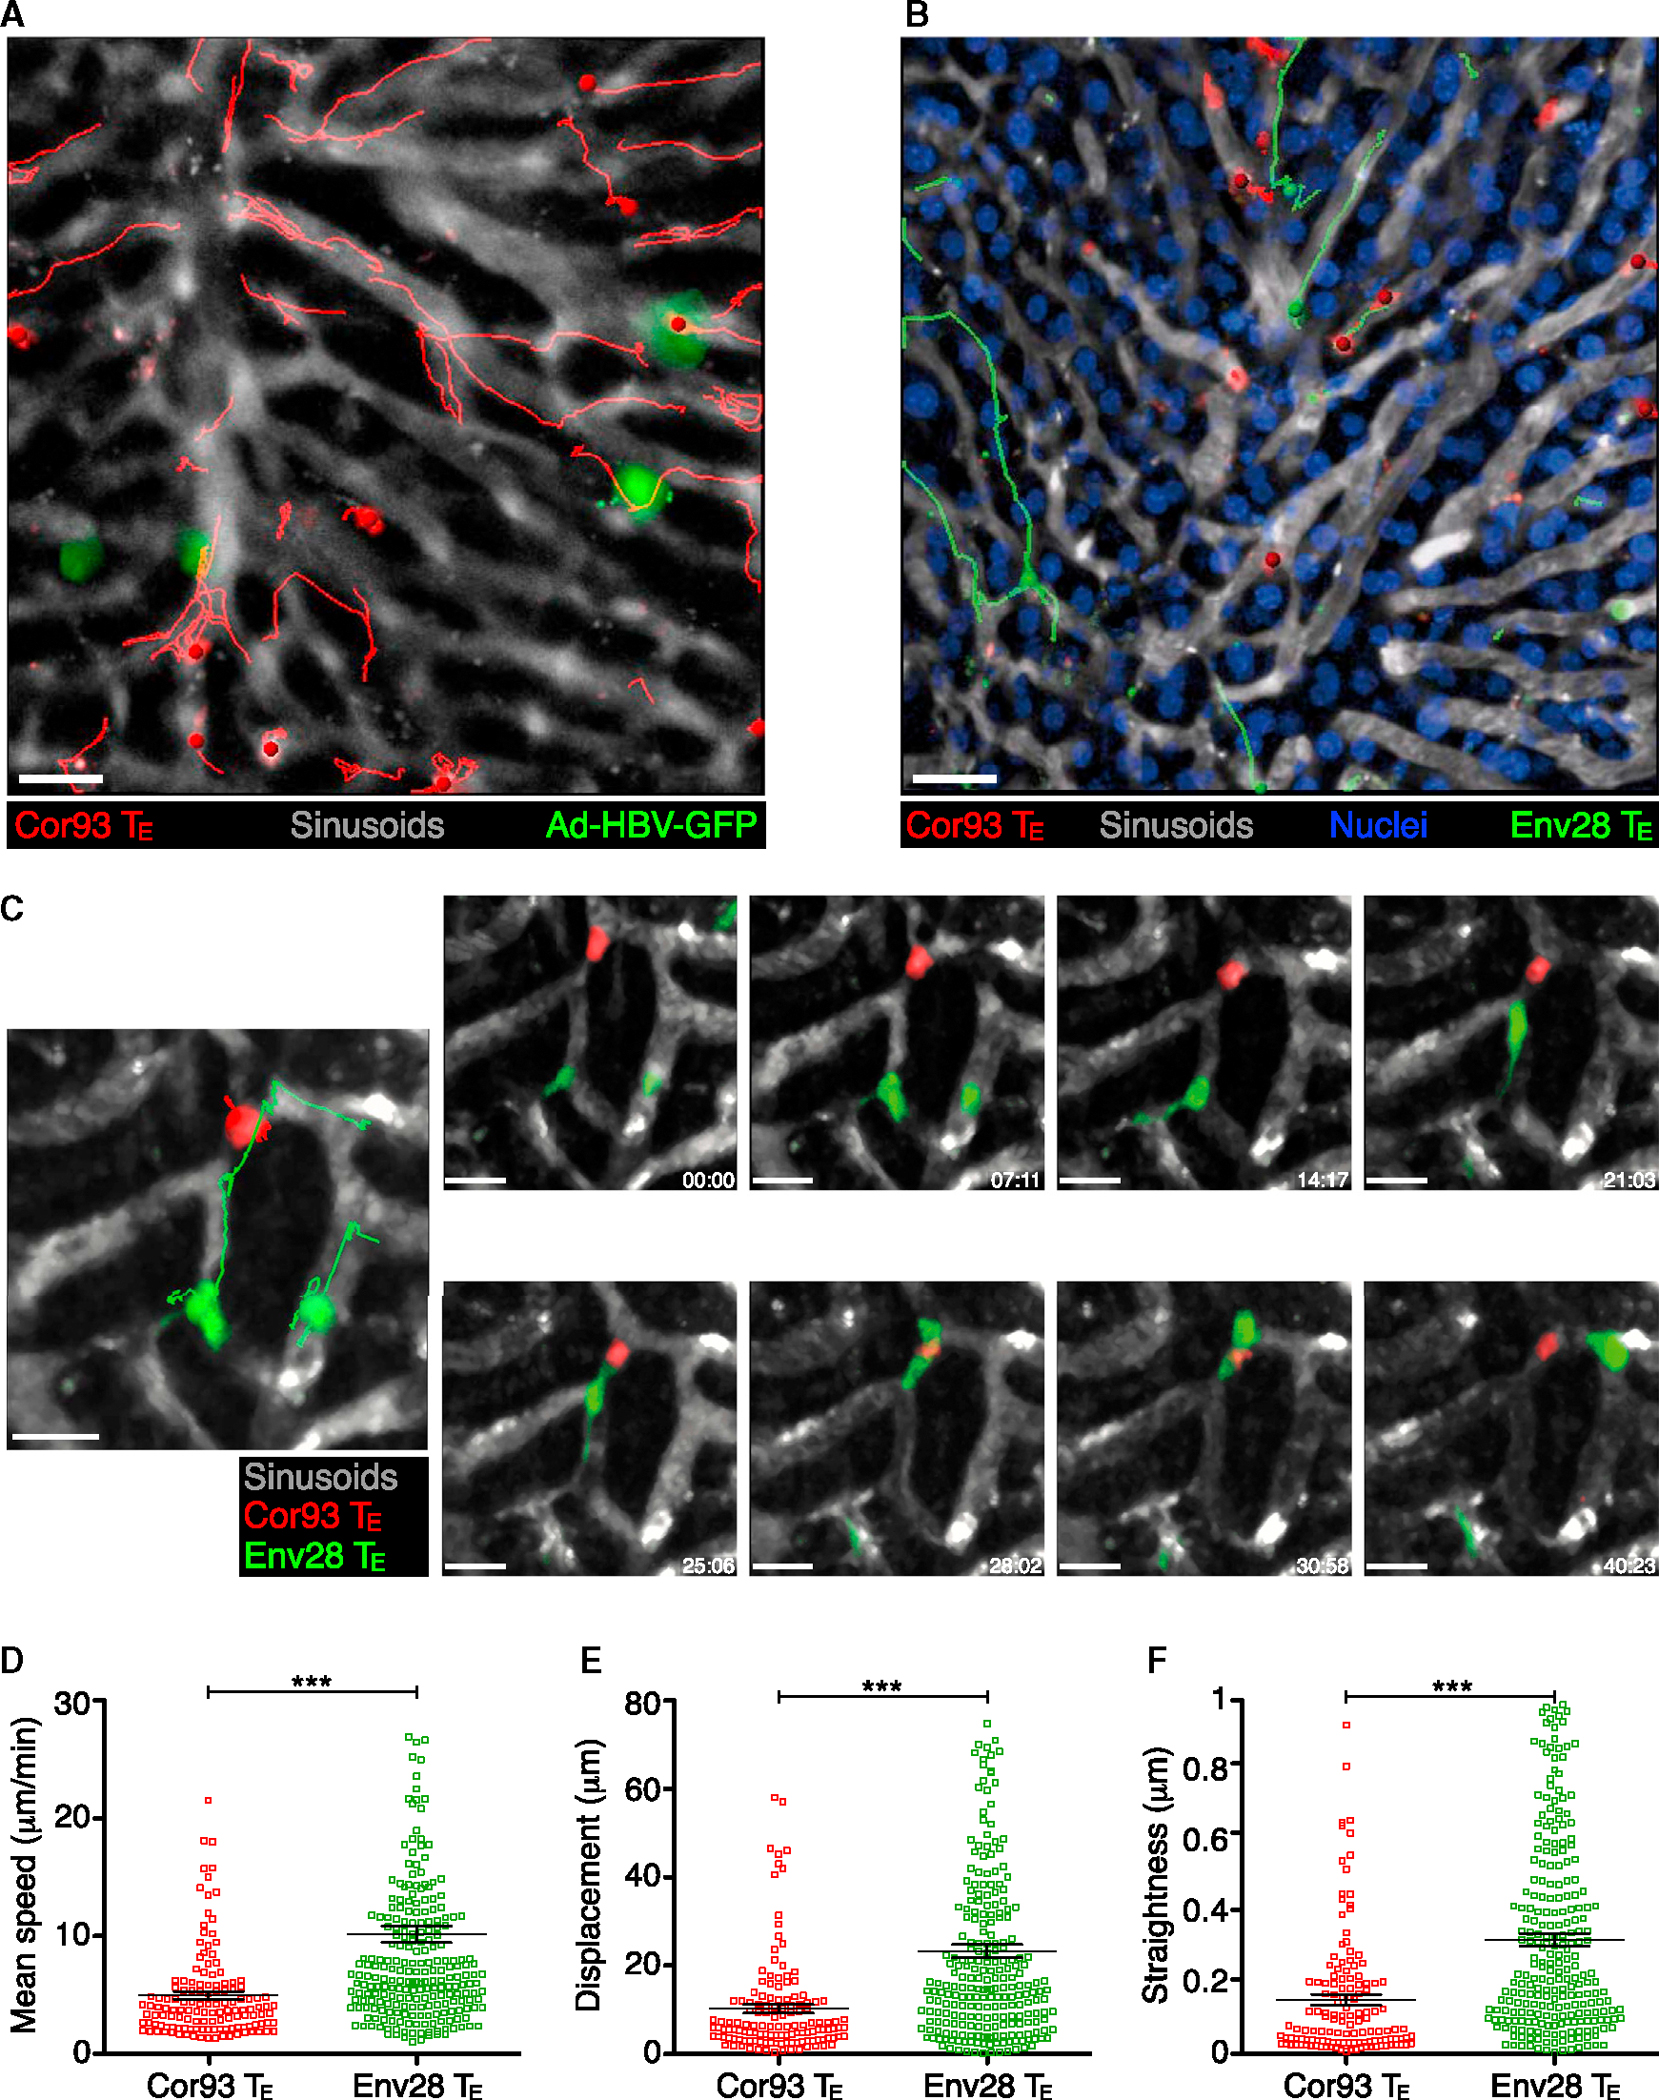
(A) Intrasinusoidal crawling of CD8 TE, visualized by multiphoton IVM (still image from Movie S4) in the liver of a WT mouse that was injected with Ad-HBV-GFP 2 days prior to Cor93 CD8 TE transfer. The movie was recorded ~1 hr after Cor93 CD8 TE transfer. Red lines denote tracks of individual Cor93 CD8 TE. Sinusoids are in gray. Scale bar represents 50 μm. Similar results were obtained when Env28 CD8 TE were transferred into Ad-HBV-GFP-injected mice or when Cor93 or Env28 CD8 TE were transferred into WT mice previously injected with AAV-HBcAg-GFP or AAV-HBsAg-GFP, respectively (data not shown).
(B) Intrasinusoidal crawling of CD8 TE, visualized by multiphoton IVM (still image from Movie S5) in the liver of a HBcAg transgenic mouse (H2b) that was injected with H2b-restricted Cor93 (red) and H2d-restricted Env28 (green) CD8 TE. Red and green lines denote tracks of individual Cor93 and Env28 CD8 TE, respectively. Sinusoids are in gray and hepatocellular nuclei are in blue. Scale bar represents 50 μm.
(C) Still image (large left panel) and time lapse recording (small right panels) in the liver of a HBcAg transgenic mouse (H2b) that was injected with Cor93 (red) and Env28 (green) CD8 TE. Red and green lines denote tracks of individual Cor93 and Env28 CD8 TE, respectively. Sinusoids are in gray. Elapsed time in minutes:seconds. Scale bar represents 15 μm (left) and 10 μm (right).
(D–F) Mean speed (D), displacement (E), and straightness (F) (see Experimental Procedures) of individual Cor93 (red) and Env28 (green) CD8 TE in the liver of a HBcAg transgenic mouse (H2b). Data are representative of two independent experiments.
Results are expressed as mean ± SEM. ***p < 0.001.
Figures S3 and S4 and Movies S4 and S5.