
Figure 5. CD8 TE Recognize Hepatocellular Ags and Perform Effector Functions in a Diapedesis-Independent Manner.
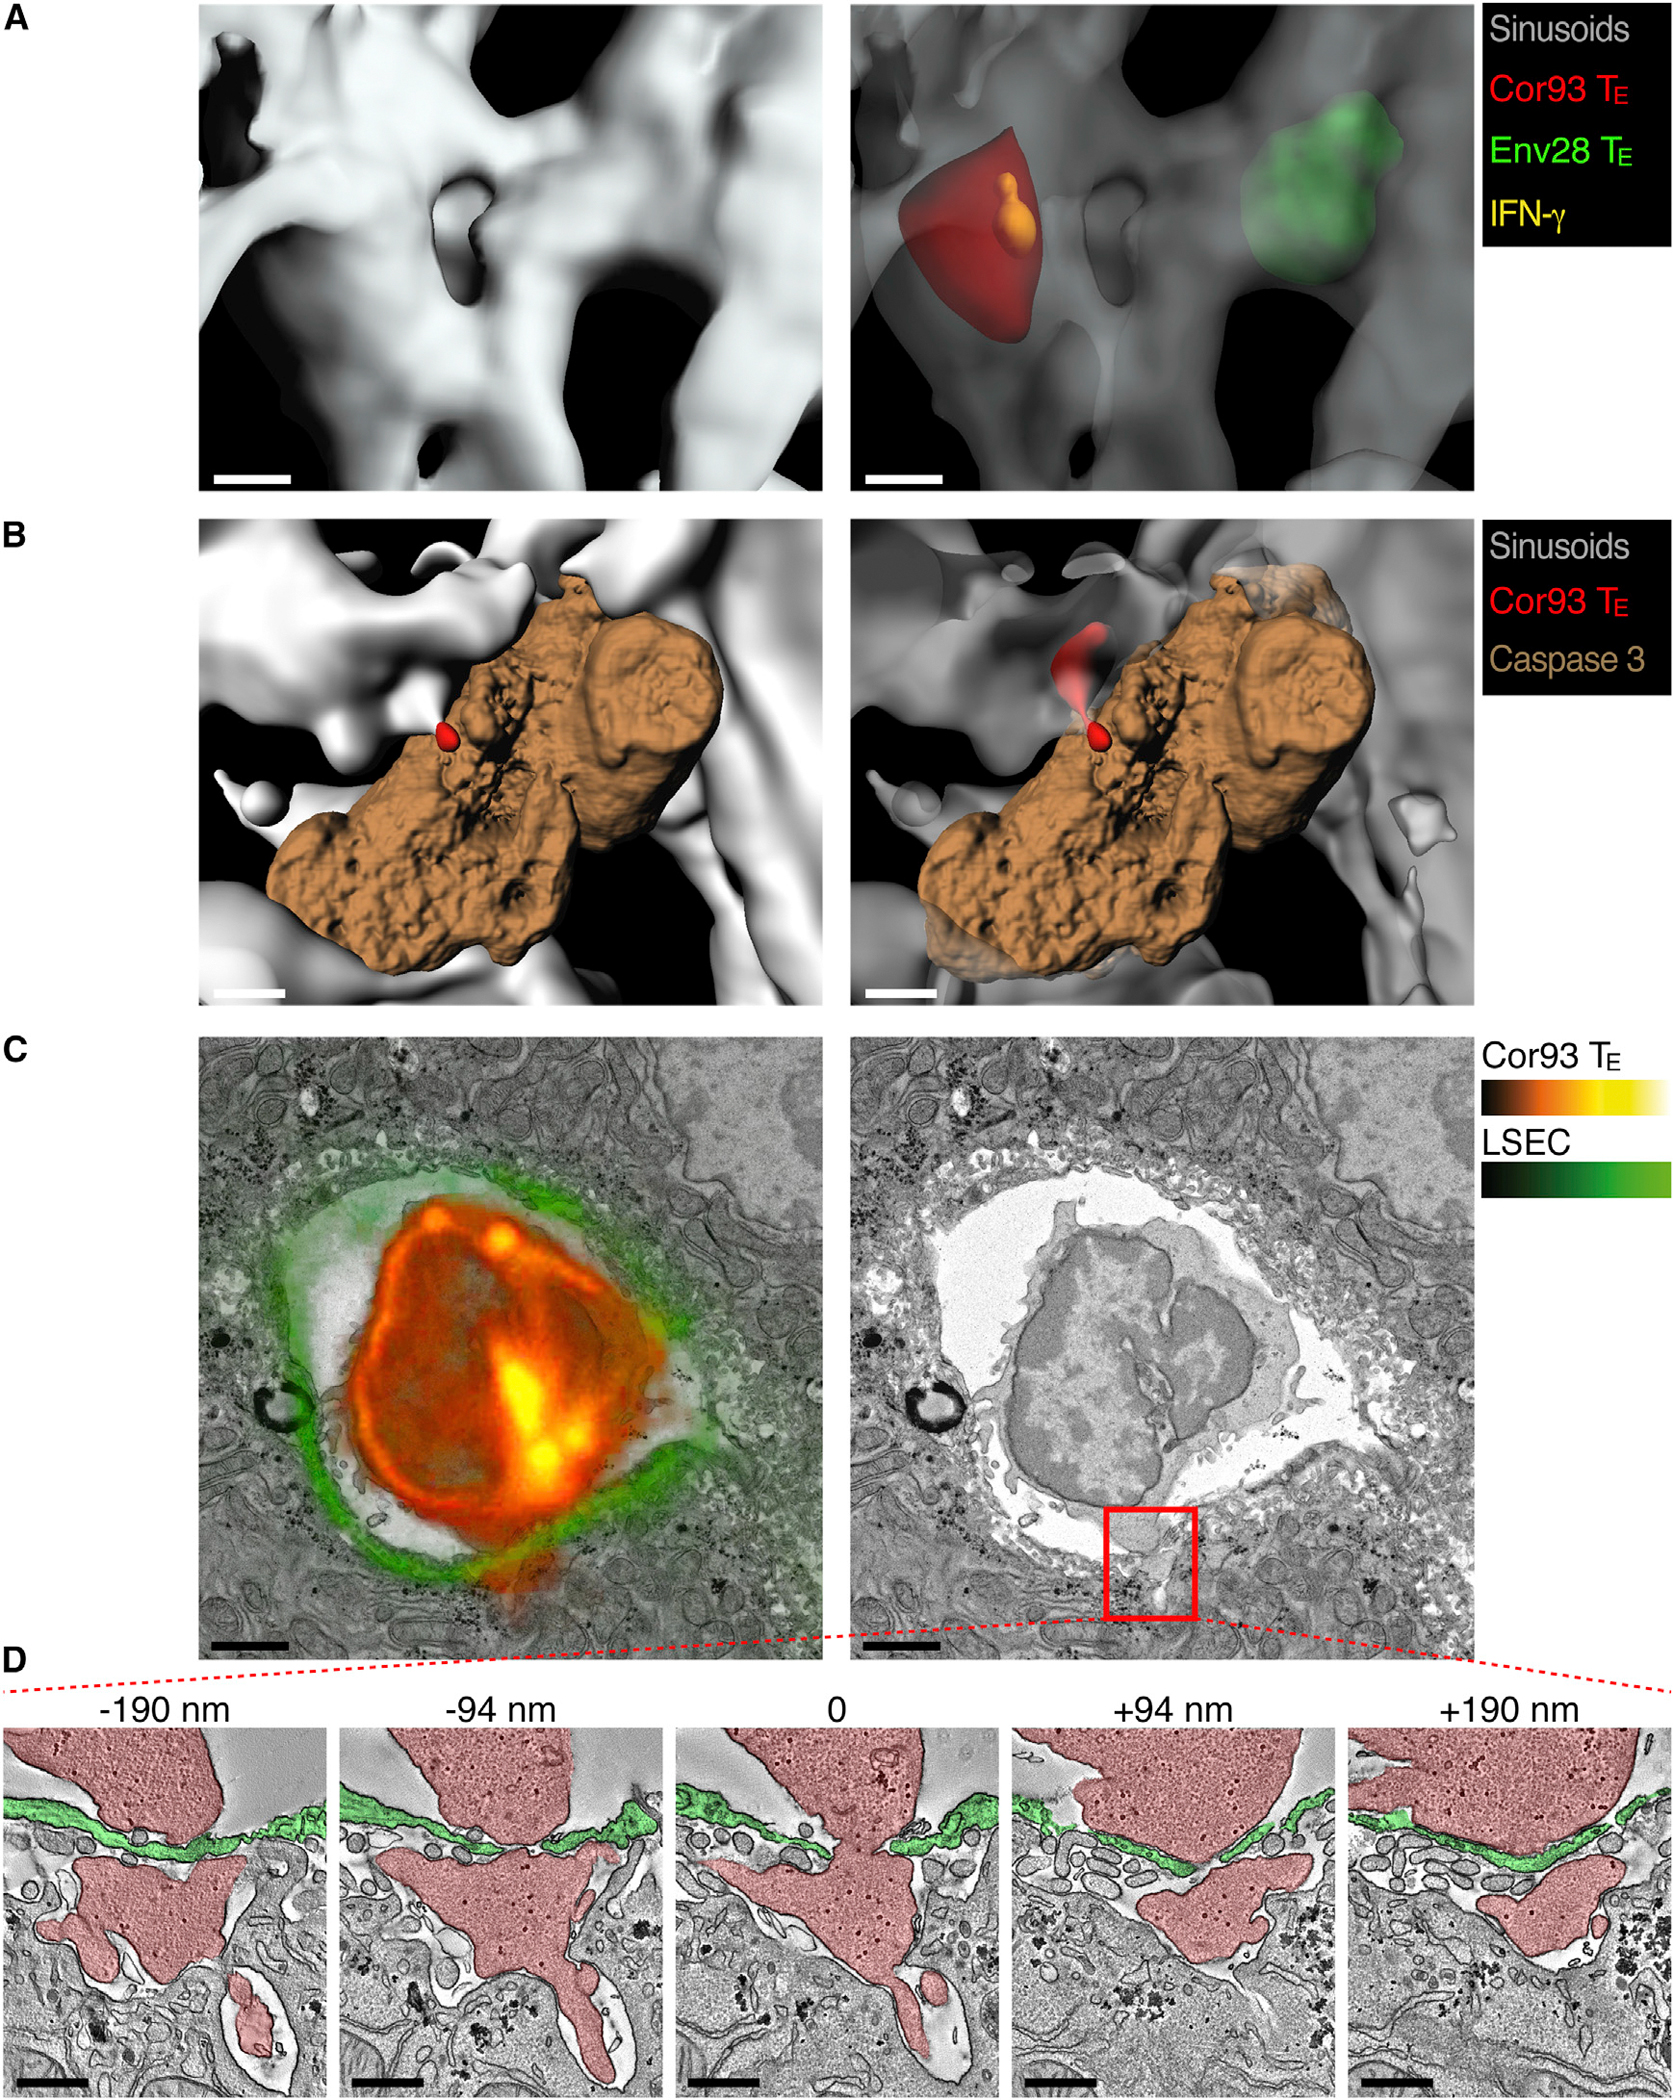
(A) Representative confocal micrographs of the liver of a HBV replication-competent transgenic mouse (H2b) that was injected 2 hr earlier with Cor93 (red) and Env28 (green) CD8 TE. Sinusoids are shown in gray and IFN-γ in yellow. To allow visualization of intravascular events and to enhance image clarity, the transparency of the sinusoidal rendering in the right panel was set to 70% and that of T cells to 60%. Scale bars represent 4 μm. See also Movie S6 and Figure S5. Similar results were obtained in similarly treated HBcAg transgenic mice (data not shown).
(B) Representative confocal micrographs of the liver of a HBV replication-competent transgenic mouse (H2b) that was injected 2 hr earlier with Cor93 CD8 TE (red). Sinusoids are shown in gray and caspase 3 in brown. To allow visualization of intravascular events and to enhance image clarity, the transparency of the sinusoidal rendering in the right panel was set to 50%. Scale bars represent 5 μm. See also Movie S6 and Figure S6. Similar results were obtained in similarly treated HBcAg transgenic mice (data not shown).
(C) Correlative confocal and transmission electron microscopy of the liver of an HBcAg transgenic mouse whose LSEC express membrane-targeted tdTomato (see Experimental Procedures) that was injected 30 min earlier with Cor93 CD8 TE. Left: overlay of the Cor93 CD8 TE and LSEC fluorescence (red and green, respectively) with the electron micrograph of the same section. Right: electron micrograph alone. Scale bars represent 2 μm.
(D) Transmission electron tomograms of five selected serial slices from the area delineated by the red inset in (C). The numbers indicate the z-distance from the middle section. Cor93 CD8 TE and LSEC are indicated by the red and green overlay, respectively. Scale bars represent 500 nm. See Movie S7 for the complete tomographic reconstruction of 289 sections with a 1.95 nm z-step.
See also Figures S5, S6, and S7 and Movies S6 and S7.