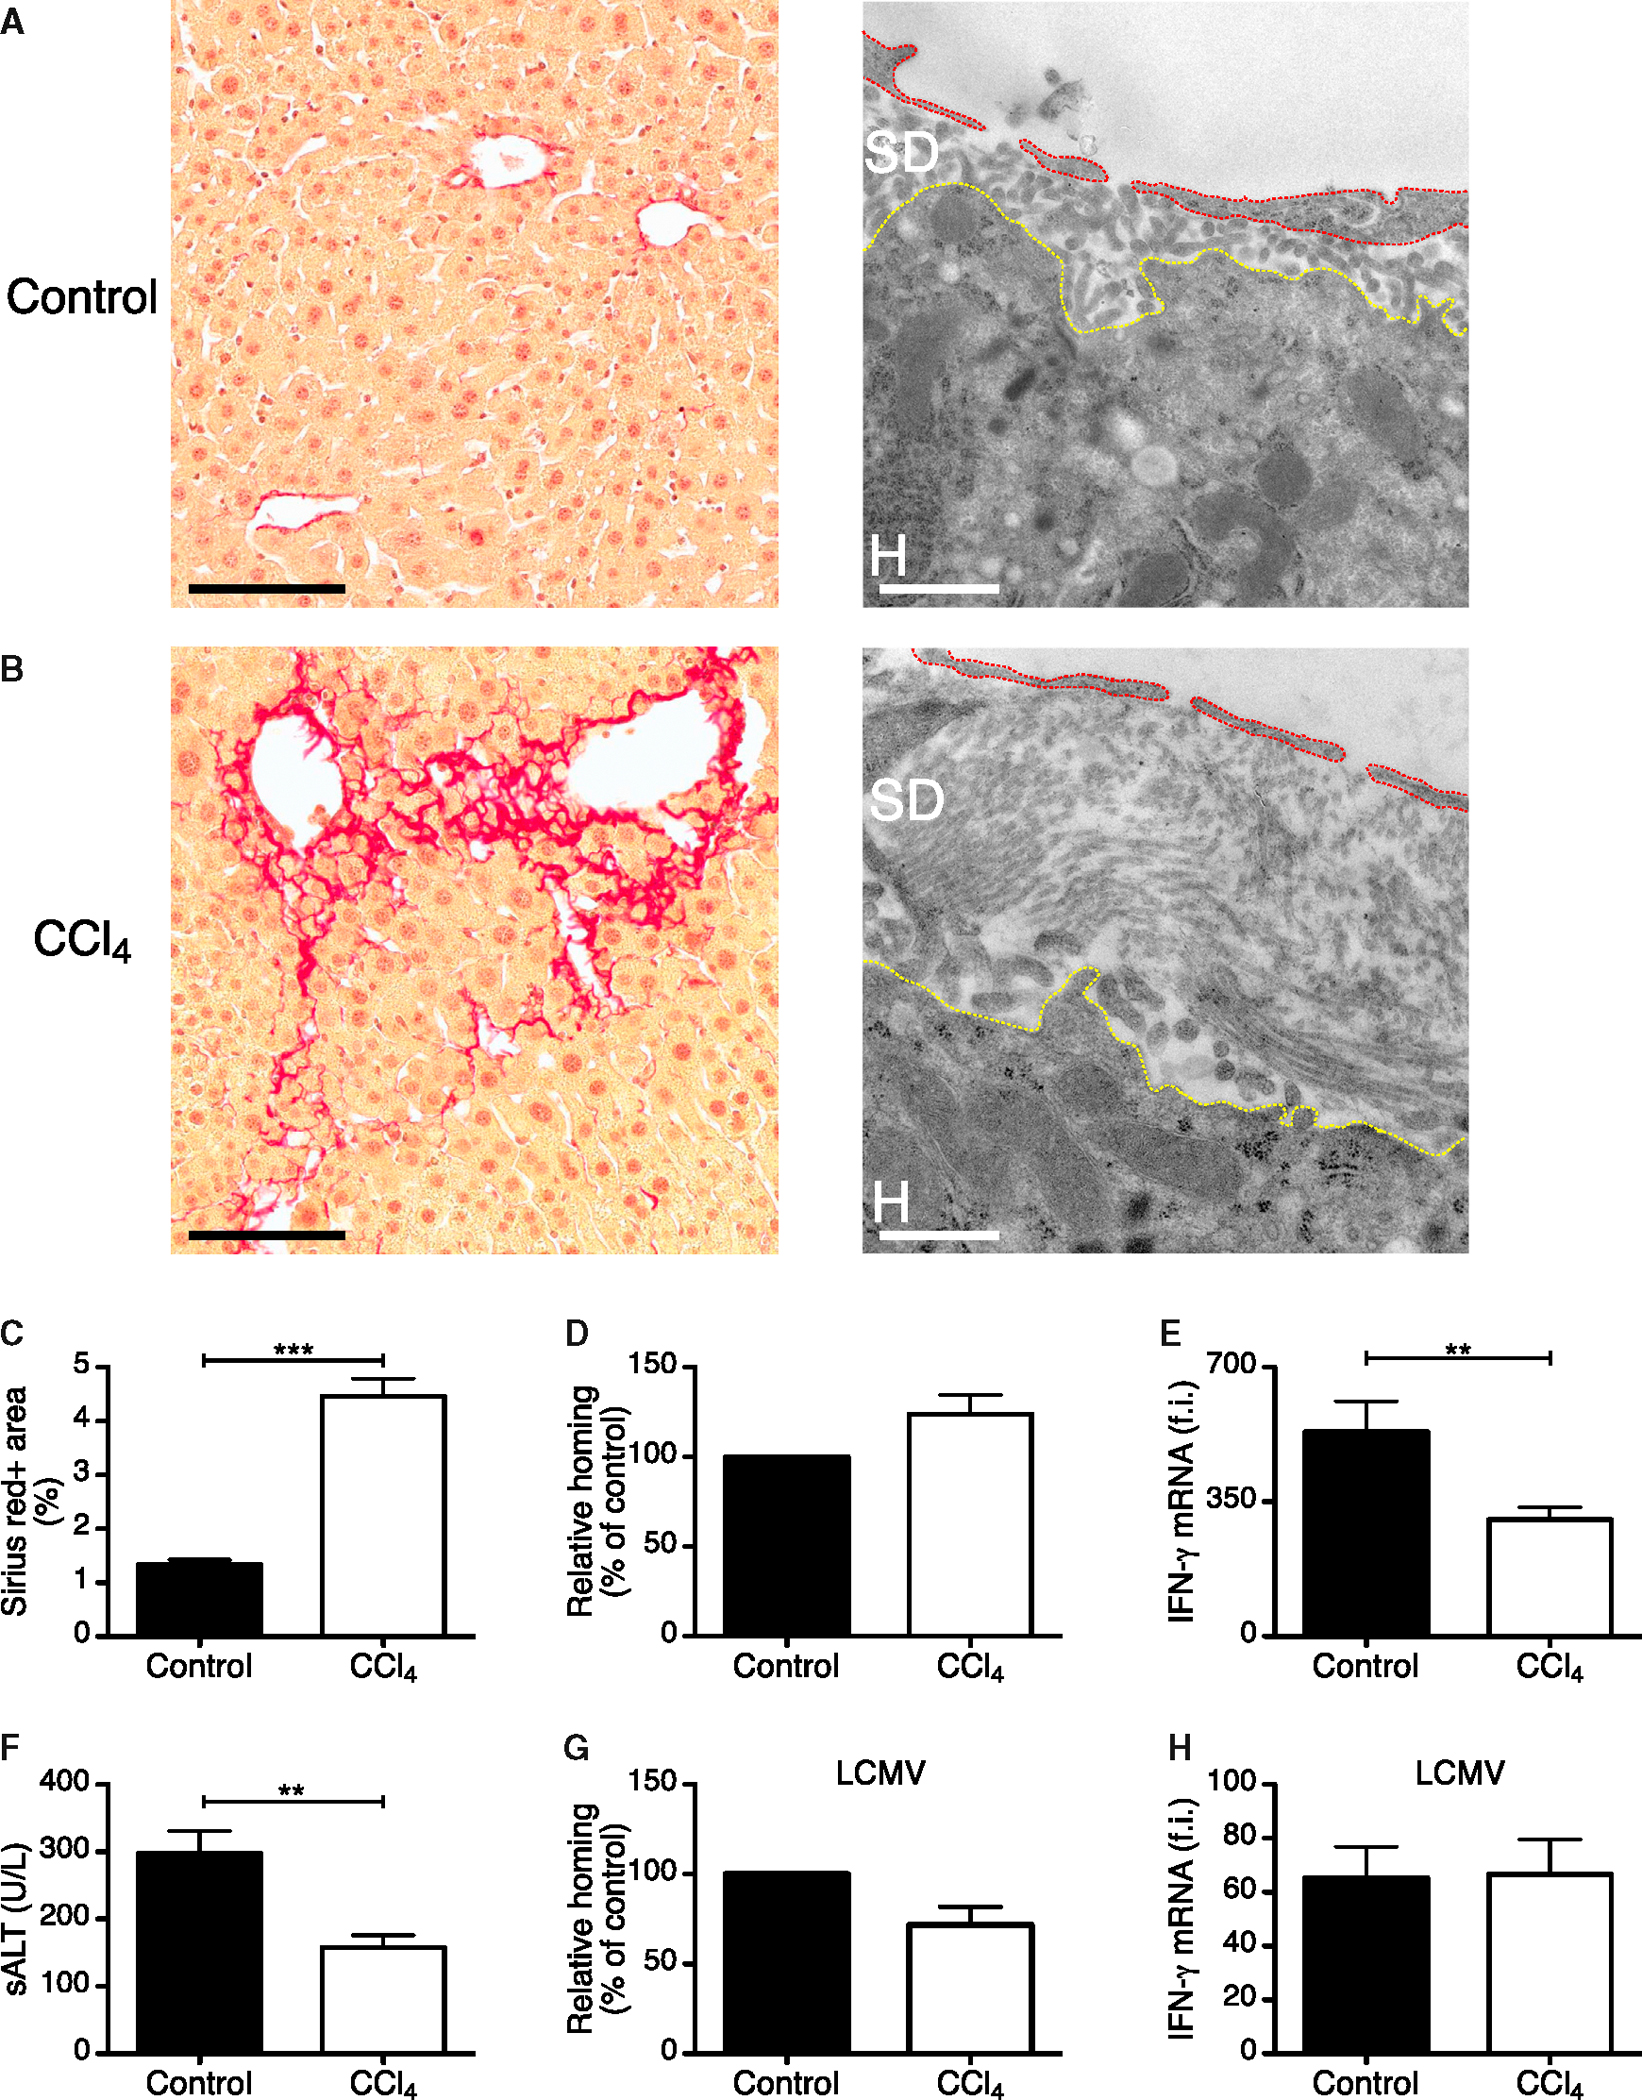
Figure 7. Liver Fibrosis Limits Hepatocellular Ag Recognition by CD8 TE.

(A and B) Representative Sirius Red (left) or transmission electron (right) micrographs from liver sections of control (A) or carbon tetrachloride (CCl4)-treated (B) HBV replication-competent transgenic mice. Sirius Red staining is shown in red. Scale bars represent 100 μm (Sirius Red) and 1.5 μm (transmission electron micrographs). Red and yellow dotted lines denote LSEC and the hepatocyte body, respectively. SD, space of Disse; H, hepatocyte.
(C) Quantification of Sirius red staining in HBV replication-competent transgenic mice that were treated or not with CCl4. n = 3; results are representative of two independent experiments.
(D) Percentage of Cor93 CD8 TE that accumulated within the liver 2 hr upon transfer into HBV replication-competent transgenic mice (H2bxd) that were previously treated with carbon tetrachloride (CCl4) relative to control (control = 100%). n = 15; results are representative of two independent experiments.
(E) Total hepatic RNA from the same mice described in (D) was analyzed for the expression of IFN-γ by qPCR. n = 15; results are representative of two independent experiments.
(F) ALT activity measured in the serum of the same mice described in (D). n = 15; results are representative of two independent experiments.
(G) Percentage of GP33 CD8 TE that accumulated within the liver 2 hr upon transfer into LCMV-infected mice that were previously treated with CCl4 relative to control (control = 100%). n = 7; results are representative of two independent experiments.
(H) Total hepatic RNA from the same mice described in (G) was analyzed for the expression of IFN-γ by qPCR. Results are expressed as fold induction (f.i.) over LCMV-infected mice injected with PBS, after normalization to the housekeeping gene GAPDH.
Results are expressed as mean ± SEM. **p < 0.01, ***p < 0.001.
