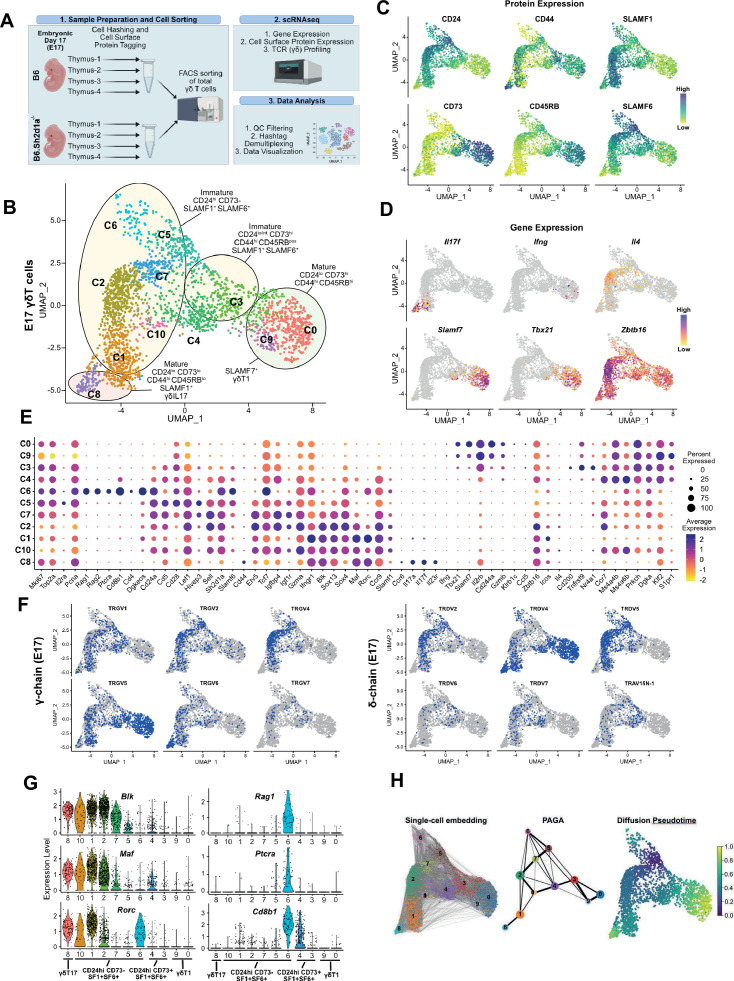
Figure 1. SLAM family receptor expression marks transcriptionally distinct developmental stages among E17 γδ T cells.
(A) Schematic workflow depicting the methodology for single-cell RNA sequencing (scRNAseq) library preparation and subsequent data analysis pipeline employed in this study. (B) Uniform manifold approximation and projection (UMAP) visualization displaying 11 distinct clusters of E17 B6 thymic γδ T cells, n = 4 individual mice. Clusters are annotated based on comprehensive protein and gene expression data. (C) Feature plots illustrating the cell surface protein expression profiles of CD24, CD73, CD44, CD45RB, SLAMF1, and SLAMF6 on B6 E17 thymic γδ T cells. Each data point represents a cell, color-coded to indicate varying protein expression levels (high: dark blue, low: yellow). (D) Feature plot illustrating the gene expression profiles of signature genes among individual B6 E17 thymic γδ T cells. Each data point represents a cell, color-coded based on gene expression levels (high: purple, low: yellow). (E) Dot plot demonstrating the scaled expression levels of selected genes in E17 B6 thymic γδ T cells. Normalized expression levels are depicted using a color scale ranging from low (yellow) to high (purple). Dot size corresponds to the fraction of cells within each cluster expressing the specific marker. (F) UMAP representation of E17 B6 thymic γδ T cells indicating the expression of selected TRGV (TCRγ; left) and TRDV (TCRδ; right) chain V-segment usage (in blue) across individual cells. (G) Violin plots illustrating the expression patterns of selected genes among E17 B6 thymic γδ T cell clusters. (H) Visualization of single-cell trajectories using PAGA (partition-based graph abstraction) with single-cell embedding (left) showing connectivity between individual nodes (middle). Weighted edges represent statistical measures of interconnectivity. The diffusion pseudotime plot (right) delineates inferred pseudotime progression of cells along developmental trajectories using cluster 5 (C5) as the root, highlighting their developmental order (from purple to yellow).


