. 2024 Dec 10;13:RP97229. doi: 10.7554/eLife.97229

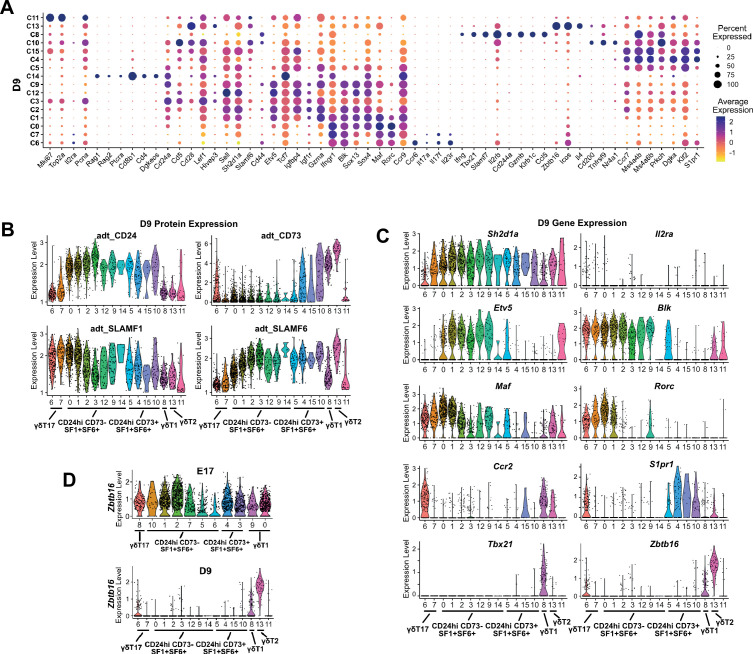
Figure 4. Identification of SAP-dependent developmental checkpoints during neonatal γδ T cell developmental programming.

(A) Uniform manifold approximation and projection (UMAP) representation of B6 (left) and B6.Sh2d1a-/- (right) γδ T cells from D9 neonatal thymi (n = 3 mice per strain). Cluster annotation is based on comprehensive protein and gene expression data. (B) Feature plots displaying cell surface protein expression patterns of CD24, CD73, SLAMF1, and SLAMF6 on D9 B6 thymus γδ T cells. Data are color-coded based on protein expression level (high: dark blue, low: yellow). (C) UMAP representation of D9 B6 thymic γδ T cells exhibiting selected TRGV4 (left) and TRDV (right) chain V-segment usage (in blue) in individual cells. (D) Frequencies of B6 and B6.Sh2d1a-/- D9 thymic γδ T cell clusters. Bars represent the mean cluster frequency, error bars represent standard deviation, *p ≤ 0.05, **p ≤ 0.01, two-way ANOVA, Sidak multiple comparisons test, 3 mice/strain. (E) Representative contour plots depicting BLK and RORγt expression in B6 and B6.Sh2d1a-/- CD24posCD73neg D9 Vγ4 T cells are shown above. Cumulative frequencies of BLK and RORγt expression are shown below. The mean and standard deviation are indicated. Data are the cumulative data from three independent experiments, n = 13 B6, 16 B6.Sh2d1a-/- mice, ****p ≤ 0.0001, two-way ANOVA, Sidak’s multiple comparisons test. (F) Decreased BLK expression in immature B6.Sh2d1a-/- γδ T cells. Data represent the mean expression of the indicated proteins in D6 neonate BLKpos, RORγtpos, or cMafpos thymic γδ T cells, **p ≤ 0.01.

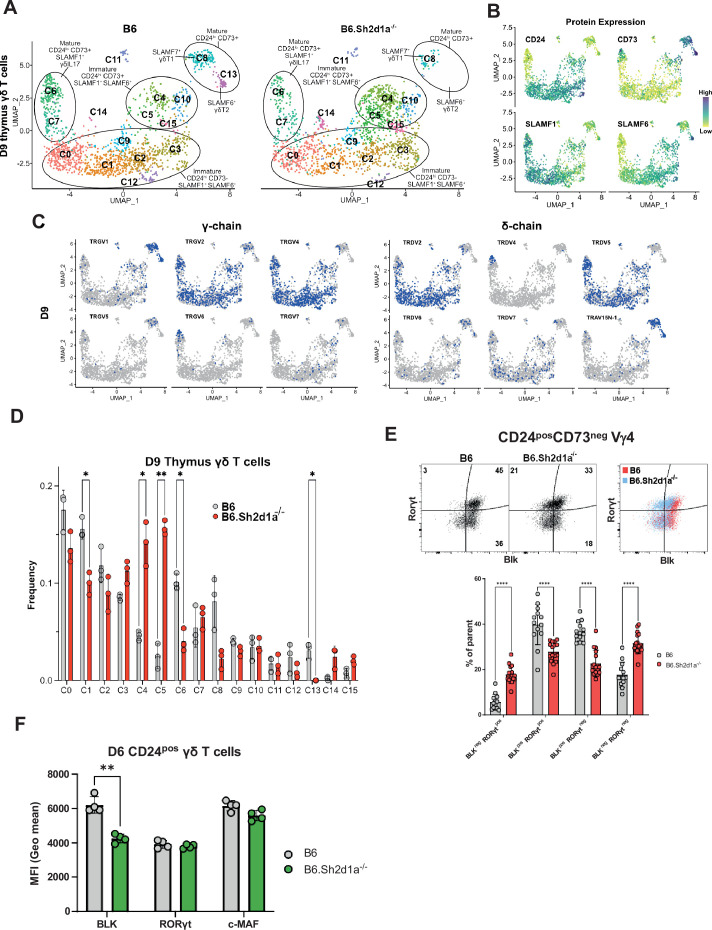
Figure 4—source data 1. Comparison of BLK, RORγt, and cMaf expression among neonatal thymic γδ T cells.

Figure 4.

Figure 4—figure supplement 1. Transcriptional heterogeneity in neonatal thymic γδ T cells.

Figure 4—figure supplement 1.

(A) Dot plot showing scaled expression level of selected genes in B6 D9 thymic γδ T cells. Level of normalized expression is shown using a color scale ranging from low (yellow) to high (purple). Dot size represents the fraction of cells within each cluster that express the marker. (B) Violin plots showing the specificity of the oligo-conjugated antibody derived tags (ADT) to cell surface proteins (CD24, CD73, SLAMF1, SLAMF6) among different B6 D9 thymus γδ T cell clusters. (C) Violin plots showing expression levels of selected genes among individual clusters in the B6 D9 thymic γδ T cells. (D) Violin plots showing expression levels of Zbtb16 gene (expressing PLZF) among individual clusters in the B6 E17 (top) and D9 (bottom) thymic γδ T cells.
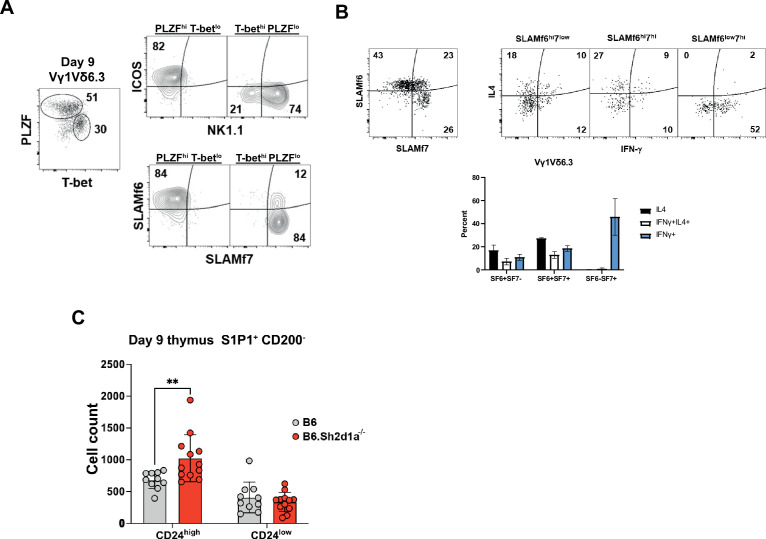
Figure 4—figure supplement 2. Flow cytometric analysis of D9 thymic γδ T cells.

Figure 4—figure supplement 2.

(A) SLAMF6 and SLAMF7 expression defines γδNKT cell subsets. Left, representative dot plot of PLZF and T-bet expression in B6 D9 thymic Vγ1Vδ6.3 γδNKT cells. Representative contour plots of ICOS and NK1.1 (top right) and SLAMF6 and SLAMF7 (bottom right) staining in PLZFhiT-betlow and PLZFlowT-bethigh subsets are shown at right. Data are representative of two independent experiments with a total of ten mice. (B) Left, representative dot plot of SLAMF6 and SLAMF7 expression in B6 D9 thymic Vγ1Vδ6.3 γδNKT cells. Right, representative dot plots of intracellular IL4 and IFN-γ expression in SLAMF6hiSLAMF7low, SLAMF6highSLAMF7hi, and SLAMF6lowSLAMF7hi γδNKT cell subsets. Numbers indicate percentage. Cumulative data of IL-4 and IFN-γ expression is shown below. Data are representative of two independent experiments with a total of 10 mice. (C) Increased number of immature CD200-S1P1+ γδ T cells in SAP-deficient neonatal thymus.
Figure 4—figure supplement 2—source data 1. Phenotypic characterization of neonatal thymic γδ T cells.
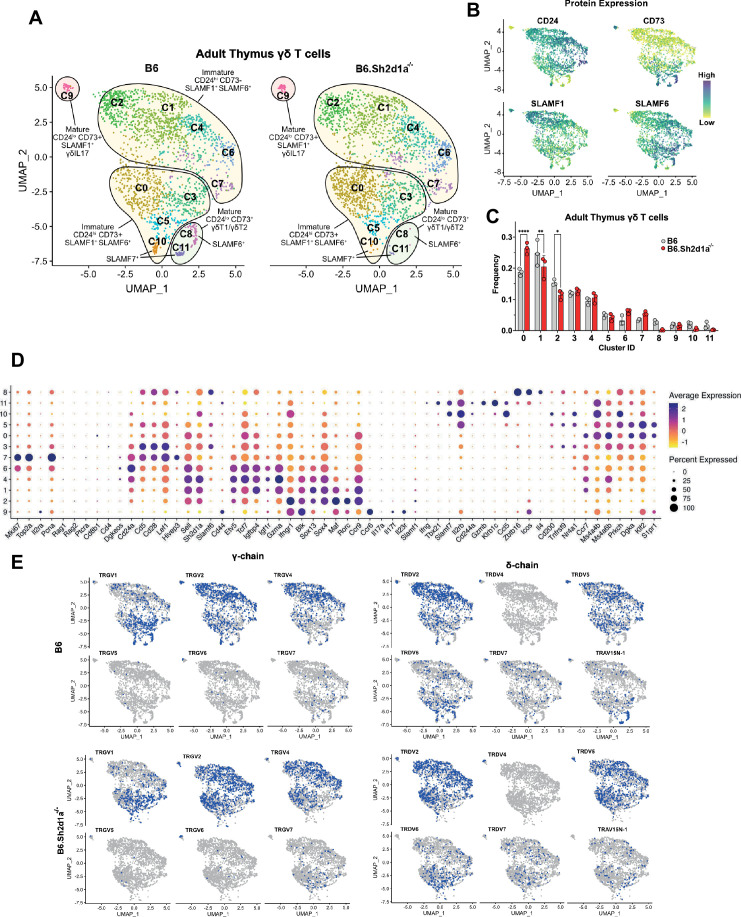
Figure 4—figure supplement 3. scRNAseq with TCR repertoire profiling of B6 and B6.Sh2d1a-/- adult thymic γδ T ells.

Figure 4—figure supplement 3.

(A) Uniform manifold approximation and projection (UMAP) representation of B6 and B6.Sh2d1a-/- adult thymus (6 weeks old) γδ T cells, n = 3 mice per strain. (B) Feature plots illustrating the cell surface protein expression profiles of CD24, CD73, SLAMF1, and SLAMF6 on adult thymic γδ T cells. Each data point represents a cell, color-coded to indicate varying protein expression levels (high: dark blue, low: yellow). (C) Frequencies of B6 and B6.Sh2d1a-/-γδ T cell clusters. Bars represent the mean cluster frequency, error bars represent standard deviation, *p ≤ 0.05, **p ≤ 0.01, ****p ≤ 0.0001, two-way ANOVA, Sidak multiple comparisons test. (D) Dot plot showing scaled expression level of selected genes in B6 adult thymic γδ T cells. Level of normalized expression is shown using a color scale ranging from low (yellow) to high (purple). Dot size represents the fraction of cells within each cluster that express the marker. (E) Expression of selected TRG (left) and TRDs chain (right) V-segment usage (blue) by individual adult thymus γδ Τ cells in B6 and B6.Sh2d1a-/- mice.