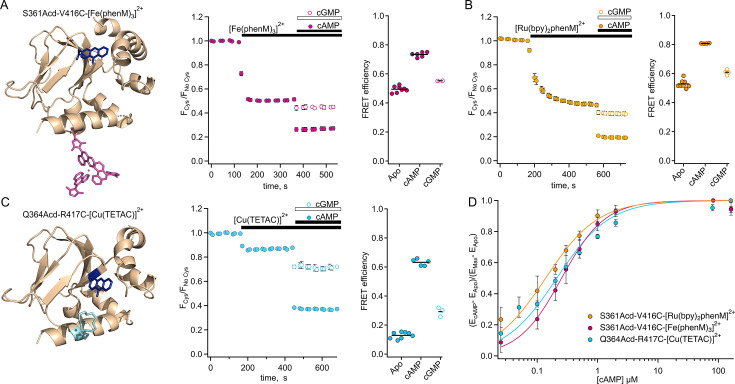
Figure 3. Steady-state tmFRET data from tetrameric SthKCterm.
(A) Left: structure of one subunit of SthKCterm-S361Acd with [Fe(phenM)3]2+ acceptor incorporated at V416C (adapted from PDB: 4D7T; Kesters et al., 2015). Middle: Time course of average fluorescence upon addition of [Fe(phenM)3]2+ and then cAMP or cGMP (apo, n=8; cAMP n=6; and cGMP, n=2). Right: summary of the FRET efficiencies from individual experiments, with mean values as horizontal lines. (B) Left: Time course of average fluorescence for same site upon addition of [Ru(bpy)2phenM]2+ acceptor and then cAMP or cGMP (apo, n=8; cAMP, n=4; and cGMP, n=4). Right: summary of FRET efficiencies, with mean values as horizontal lines. (C) Left: structure of one subunit of SthKCterm-Q364Acd-417C with [Cu(TETAC)]2+ acceptor incorporated at R417C. Middle: Time course of averaged fluorescence upon addition of [Cu(TETAC)]2+ then cAMP or cGMP (apo, n=8; cAMP, n=5; and cAMP, n=3). Right: summary of FRET efficiencies, with mean values as horizontal lines. (D) Dose response relations of FRET efficiency change as a function of cAMP concentration normalized for comparison and fit with Hill equations (: 0.25±0.01 µM, 0.14±0.01 µM, 0.21±0.02 µM, and h:1.2±0.07, 1, and 1 for [Fe(phenM)3]2+, magenta; [Ru(bpy)2phenM]2+, orange; and [Cu(TETAC)]2+, cyan respectively, ± SD).


